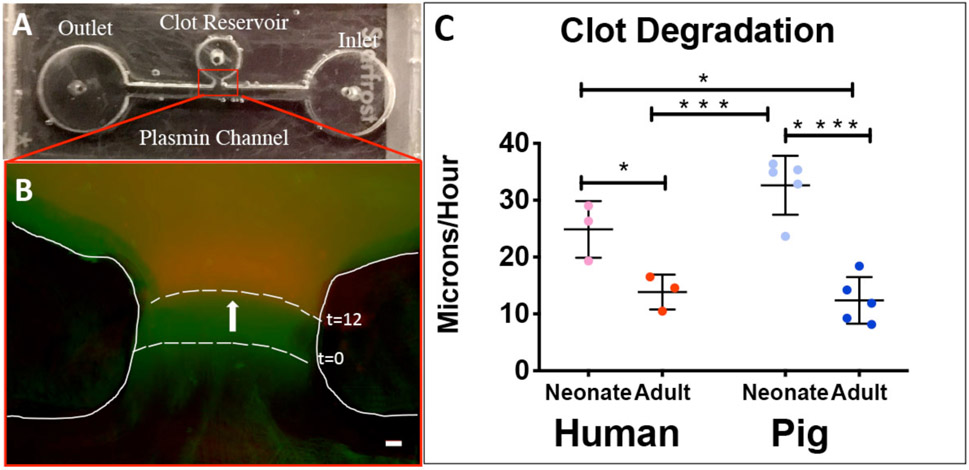
Figure 6.
Evaluation of plasma clot degradation with a custom microfluidic device. Top view of the device (A). Initial (green) and final (red) frames of clot boundary overlaid with false coloring (B). Average Degradation rates +/− standard deviation. neonatal humans: N=3, adult humans: N=3, neonatal pigs: N=5, adult pigs: N=5. Scale = 10 μm. *p<0.05, **p<0.01, ***p<0.001, ****p<0.0001.

