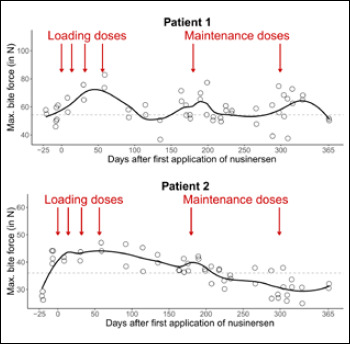
Figure 3.

Maximum bite force in patient 1 and patient 2 over the first year of nusinersen therapy. Each circle indicates the mean value of 10 observations of maximum bite force per measurement point. Solid lines indicate the LOESS curve over time. Dashed lines indicate the mean maximum bite force before the first application of nusinersen.
