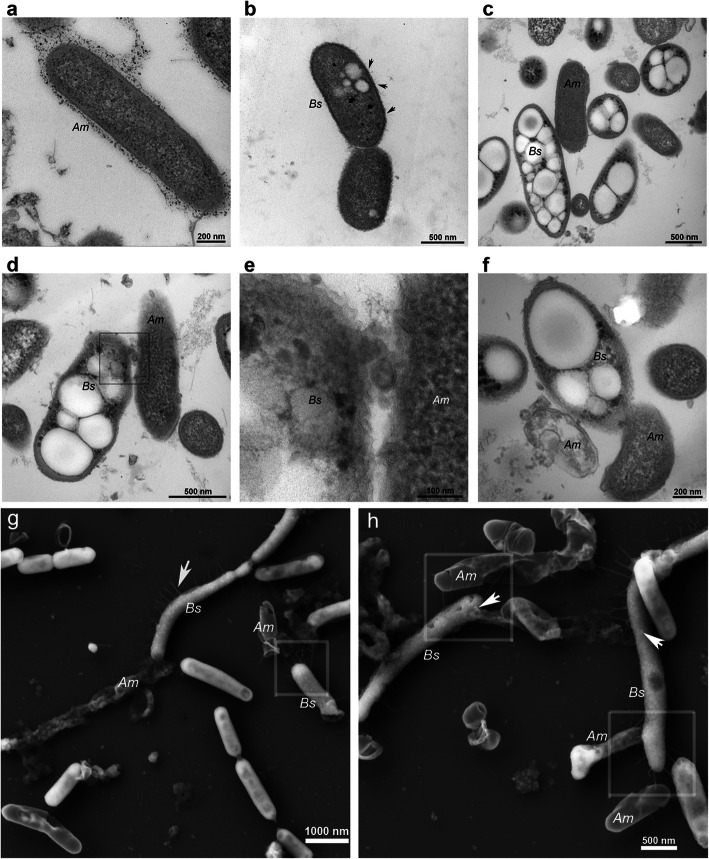
Fig. 2.
TEM and SEM micrographs of Bradymonas sediminis FA350T (predator) and Algoriphagus marinus am2 (prey). We selected a prey, Algoriphagus marinus am2, which was smaller than the predator FA350T. a The free-living prey Algoriphagus marinus am2 (Am) in pure culture. Bar = 200 nm. b The free-living predator Bradymonas sediminis FA350T (Bs) in pure culture. The white globose granules in the Bs cell indicate PHA accumulation, and the black arrows indicate type IV pili. Bar = 500 nm. c Bradymonas sediminis FA350T (Bs) cells cocultured with Algoriphagus marinus am2 (Am) prey cells. The white globose granules in the cell indicate PHA accumulation, and the electron-dense (black) intracellular granules indicate polyphosphate. Bar = 500 nm. d Bradymonas sediminis FA350T (Bs) cell attached to an Algoriphagus marinus am2 (Am) prey cell with OMV-like structures (shown in box area). Bar = 500 nm. e Enlargement of the boxed area in figure (d). Bar = 100 nm. f Bradymonas sediminis FA350T (Bs) cell attached to an emptied and dead Algoriphagus marinus am2 (Am) prey cell. Bar = 200 nm. g SEM analysis of Bradymonas sediminis FA350T (Bs) cells cocultured with Algoriphagus marines am2 (Am) prey cells. The white arrow indicates type IV pili, and the boxed area indicates Bs contact with the emptied Am with type IV pili. Bar = 1000 nm. h SEM analysis of Bradymonas sediminis FA350T (Bs) cells attached to an Algoriphagus marinus am2 (Am) prey cell with type IV pili (shown in boxed area). The white arrows indicate the OMV-like structures. Bar = 500 nm

