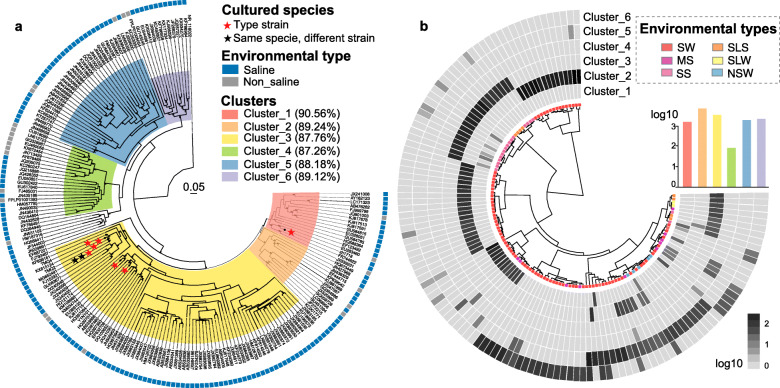
Fig. 6.
Phylogeny of 6 proposed subgroups of Bradymonabacteria. a Maximum likelihood phylogenetic tree of Bradymonabacteria based on 187 representative 16S rRNA gene sequences (> 1200 bp) dereplicated at a 98.5% cutoff. The subgroups from Cluster_1 to Cluster_6 were colored in the corresponding leaves of the tree and are shown with the similarity of each subgroup. The outer colored square indicates the sequence of the original biotope: nonsaline (gray) and saline (blue). Pentagram represents cultured Bradymonabacteria in our laboratory. All 16S rRNA gene sequences of Bradymonabacteria and the RAxML phylogenetic tree are available in Table S6. b The coverage of each subgroup of Bradymonabacteria for 127 samples. The abundance of Bradymonabacteria is expressed relative to the total number of prokaryotic sequences in the corresponding samples. The biotope types are shown by the colored nodes located under each leaf of the cluster. The bar graph indicates the read number of each cluster in the 127 samples

