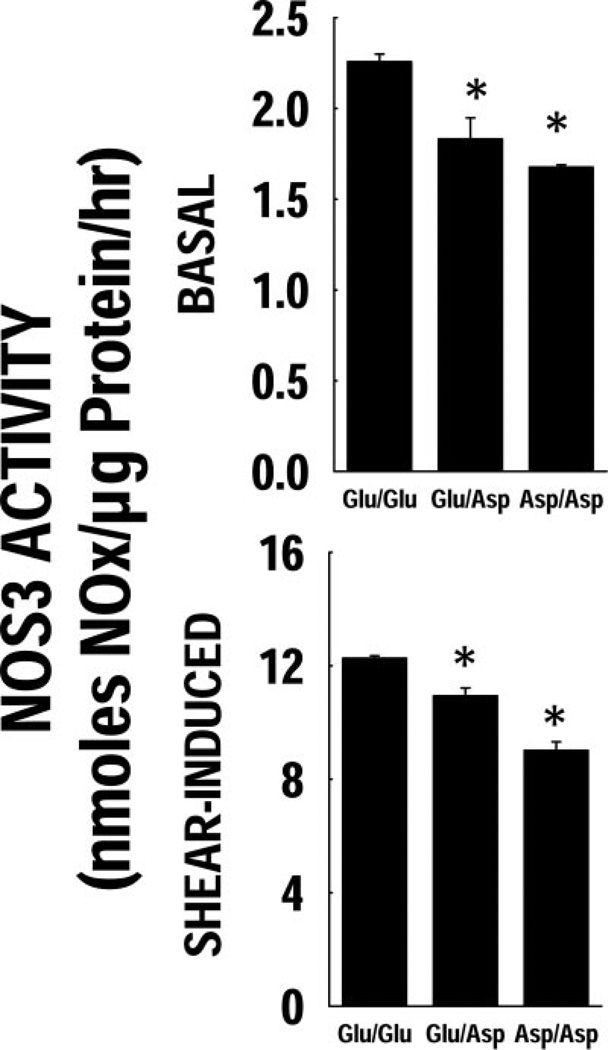
Figure 2.
Cellular NOx production post-shear. The NOx production rate pre- and post-shear is shown. The basal NOx levels were significantly lower in the Asp variant ECs. There was a significant increase in the NOx levels post-high shear in all three genotypes. The extent of NOS3 activity induction post-shear was lower in the Asp variant cells.

