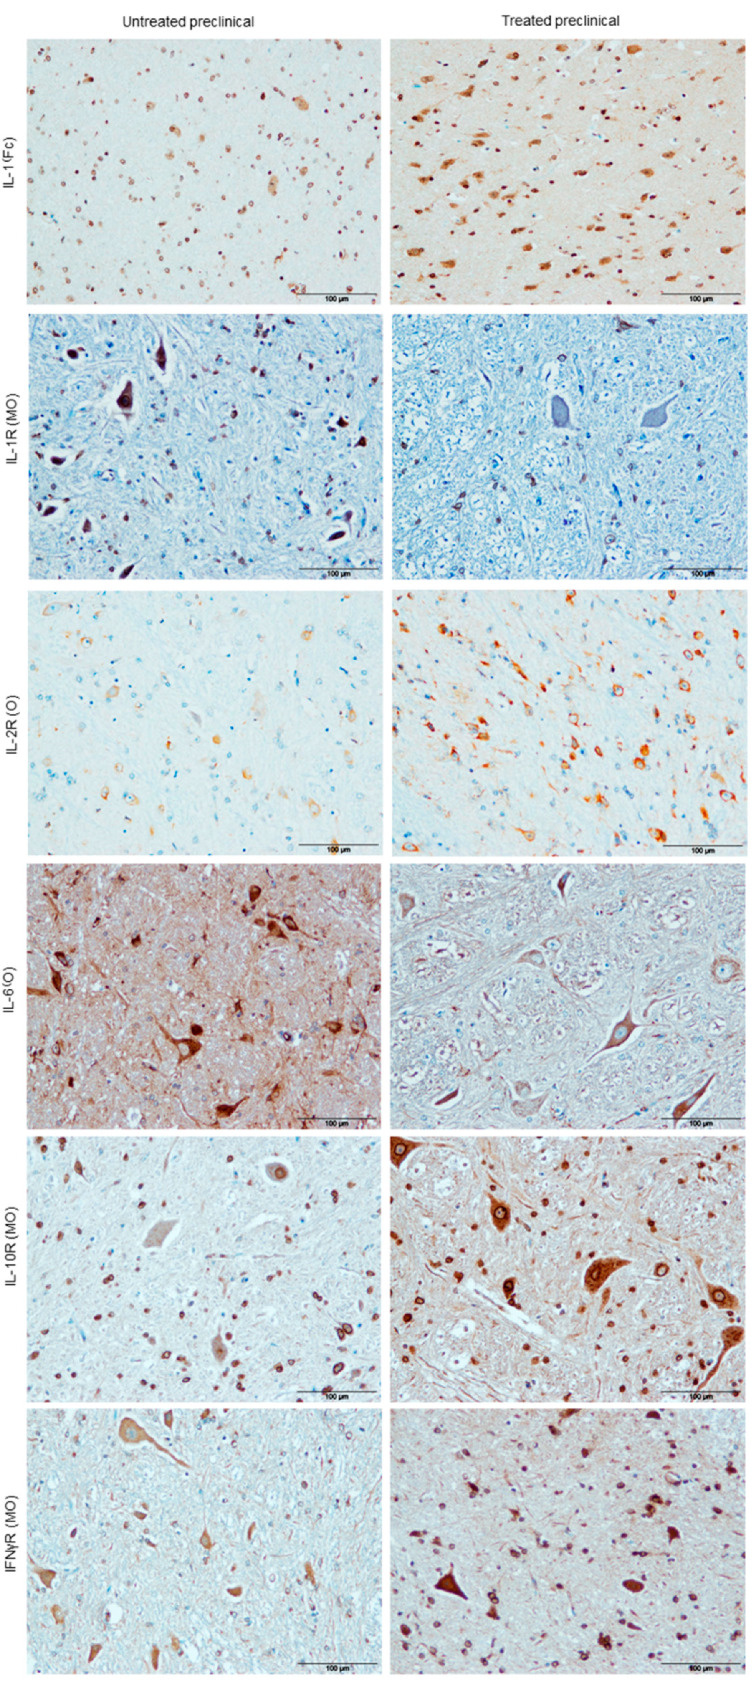
Figure 4.

Illustration of cases (one area per case per marker) where differences in immunostaining for different cytokines (IL-1α, IL-1R, IL-2R, IL-6, IL-10R and IFNγR) associated with DEX treatment were evident. Scale bars: 100 µm. Frontal cortex (Fc), obex (O), medulla oblongata (MO).
