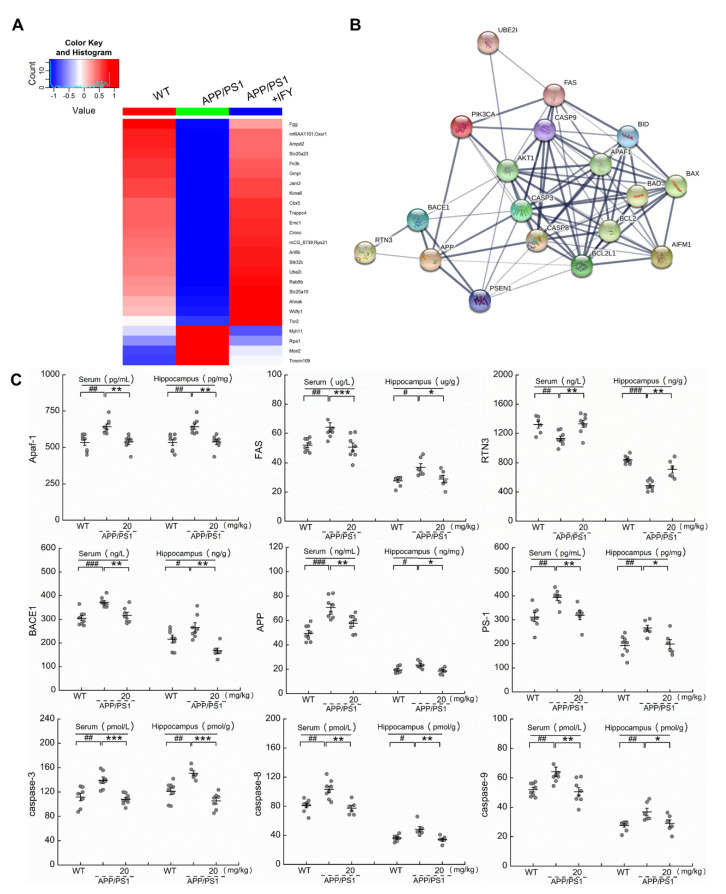
Figure 4.
IFY regulated the expressions of apoptosis-related proteins in the serum and hippocampus. (A) Color-coded two-dimensional heat maps among WT, APP/PS1 and IFY-treated APP/PS1. Red represents up-regulated protein expression values, and blue represents down-regulated values (n = 6). (B) STRING protein interactive analysis for the interaction analysis of differentially expressed proteins among WT, APP/PS1 and IFY-treated APP/PS1. The thickness of the line indicates the strength of data support. (C) IFY ameliorated apoptosis related proteins including Apaf-1, FAS, RTN3, BACE1, APP, PS-1, caspase-3, caspase-8 and caspase-9 detected by an enzyme-linked immunosorbent assay (ELISA (n = individual dots displayed for each group in all graphs)). All data shown as the mean ± SEM. # p < 0.05, ## p < 0.01, ### p < 0.001 vs. WT mice, * p < 0.05, ** p < 0.01, *** p < 0.001 vs. APP/PS1 mice.

