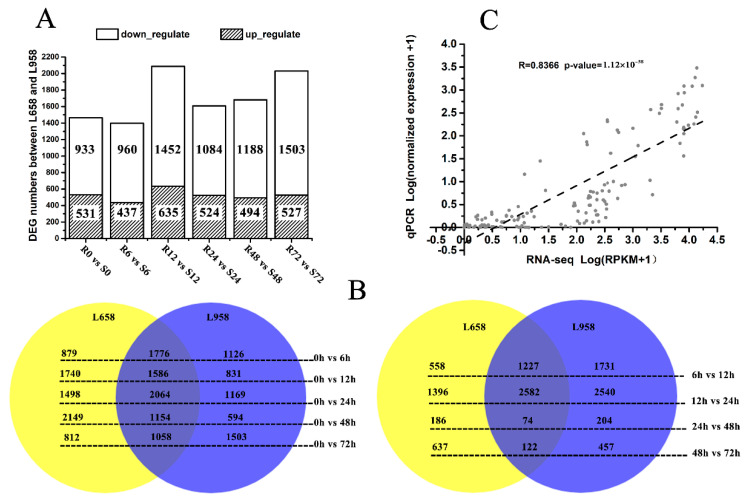
Figure 1.
Number of differentially expressed genes (DEGs) in different comparisons and reliability of RNA-seq data as demonstrated by quantitative real-time PCR (qRT-PCR). (A) Number of DEGs between L658 (R) and L958 (S) at different inoculation time points; (B) Venn diagram showing the number of DEGs shared between (overlap) and specific to L658 (yellow) and L958 (blue) at various inoculation time points compared with 0 h (left) and between two adjacent time points (right); and (C) correlations between normalized RNA-seq reads per kilobase per million (RPKM) values and normalized qRT-PCR expression values. The scatterplot shows the log10 of RPKM values +1 and the log10 of qRT-PCR expression values +1; a trend line is shown as the dotted line.

