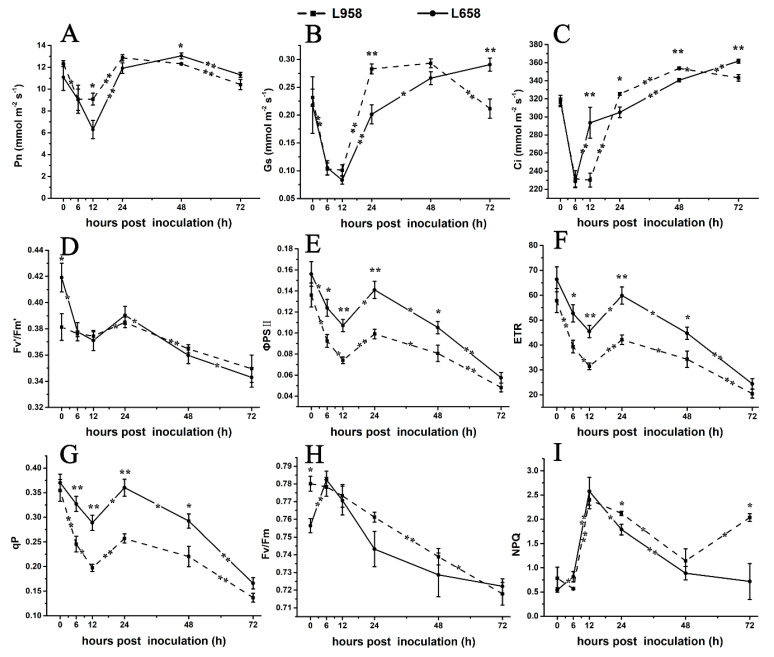
Figure 4.
Changes in photosynthesis parameters and chlorophyll florescence parameters in L658 and L958. The solid and dotted lines represent different trends in the Pn (A), Gs (B), Ci (C), Fv’/Fm’ (D), ΦPSII (E), ETR (F), qP (G), Fv/Fm (H), and NPQ (I) in L658 and L958. The meanings of the symbols are the same as those in Figure 1. The asterisks represent significant differences as follows: ** p < 0.01 and * p < 0.05. The asterisk at the top of the line chart represents the difference between L658 and L958 at each time point. The asterisk on the trend line represents the difference between two adjacent time points for the same genotype.

