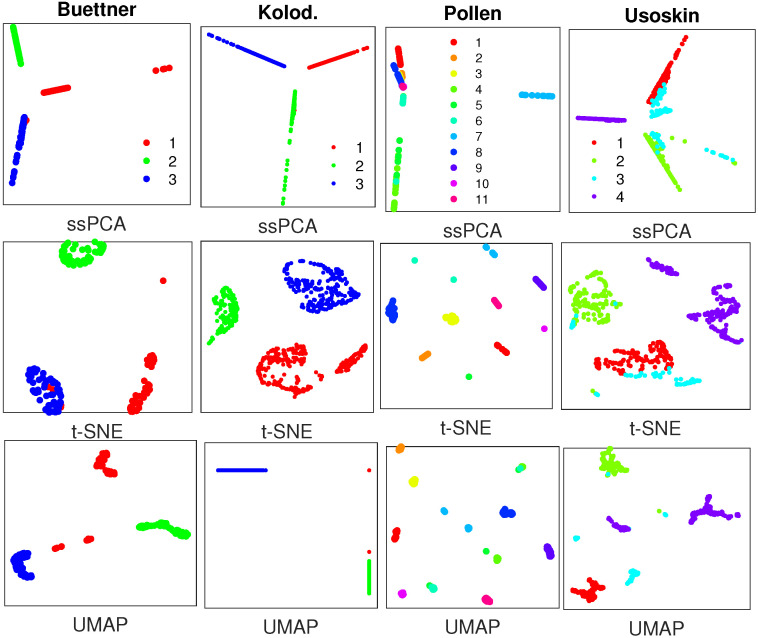
Figure 2.
Visualization results with similarity matrices from SIMLR with 4 real single-cell RNA sequencing (scRNA-seq) datasets, where plots in the top row are generated by semisupervised principal component analysis (ssPCA) with , and plots in the middle row and bottom row are produced with t-distributed stochastic neighbor embedding (t-SNE) and UMAP, respectively. Datasets to draw the the subplots from left to right: Buettner [2]; Kolodziejczyk [20]; Pollen [21]; Usoskin [5].

