Figure 8.
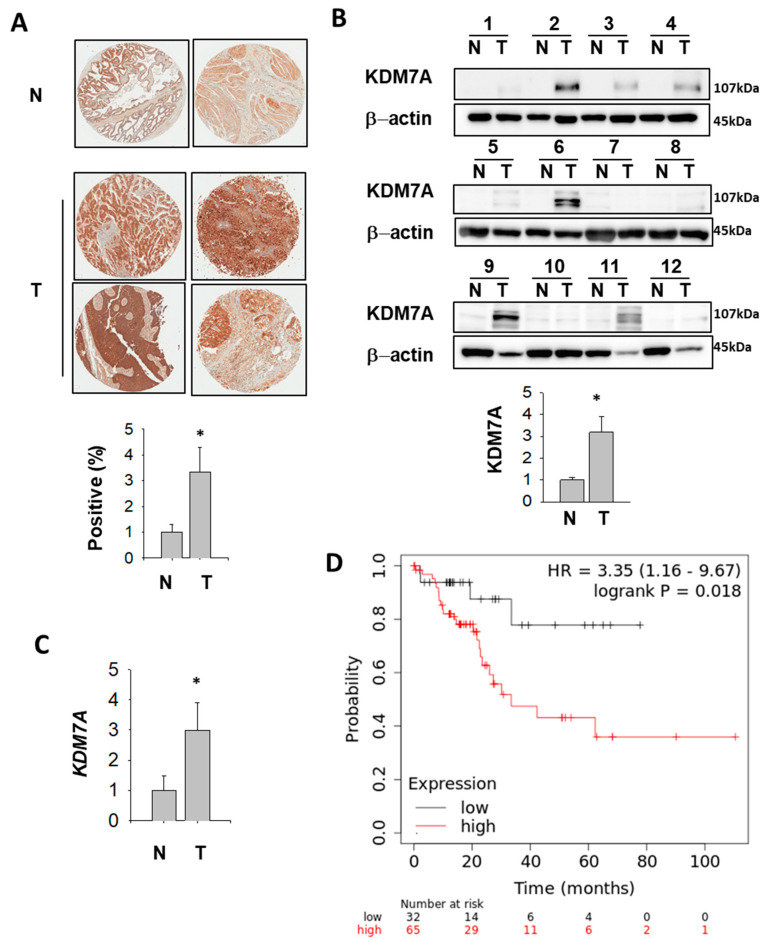
KDM7A is up-regulated in bladder cancer patients (A) Representative images of KDM7A expression in bladder tumor and normal tissue arrays (upper figures). N, normal bladder tissue; T, bladder tumor tissue. The expression level of KDM7A from 25 different bladder tumors and 6 normal tissues were calculated and plotted (below graph). * p < 0.05 (Student’s t-test) between two groups. (B) Bladder tumor (T) and adjacent normal (N) tissues were subjected to Western blotting using the KDM7A and beta actin antibodies. Protein bands were analyzed densitometrically and protein levels normalized to beta actin levels were plotted in the lower graph. * p < 0.05 (Student’s t-test) between two groups. (C) Comparison of KDM7A mRNA expression levels between normal and tumor bladder tissues. * p < 0.05 (Student’s t-test) between two groups. (D) A survival curve was plotted for male bladder cancer patients with cancer stage 2 (n = 97). Data were analyzed using the Kaplan–Meier Plotter (www.kmplot.com). Patients with expression above the median are indicated in red line, and patients with expressions below the median in black line. HR means hazard ratio.

