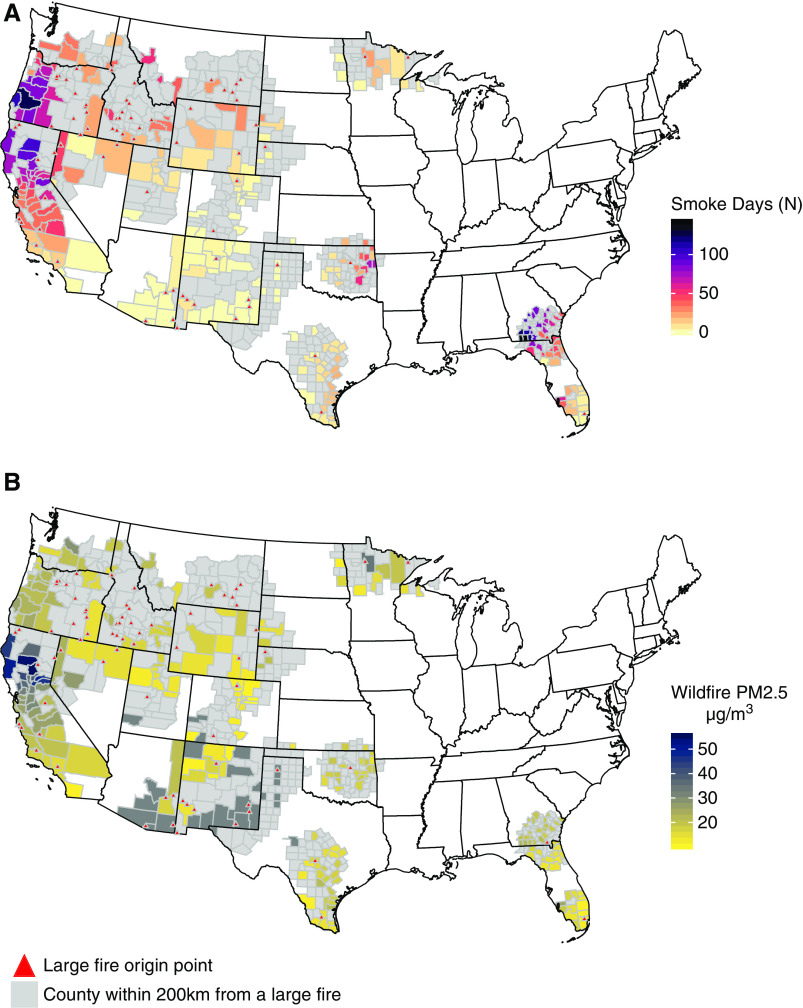
Figure 1.
Map of the study area and distribution of wildfire-related fine particulate matter (wildfire-PM2.5) by county. The locations of 63 large fires are marked with triangles. (A) The number of days with wildfire-PM2.5 contribution >10 μg/m3 for each of the 253 counties with in-center HD clinics near fire. (B) Average wildfire PM2.5 concentration on days with wildfire-PM2.5 contribution >10 μg/m3. Only counties with dialysis clinic(s) are labeled for smoke days and PM2.5. Counties in gray were within 200 km of the fire origin but did not have an in-center HD clinic or wildfire-PM2.5 >10 μg/m3.

