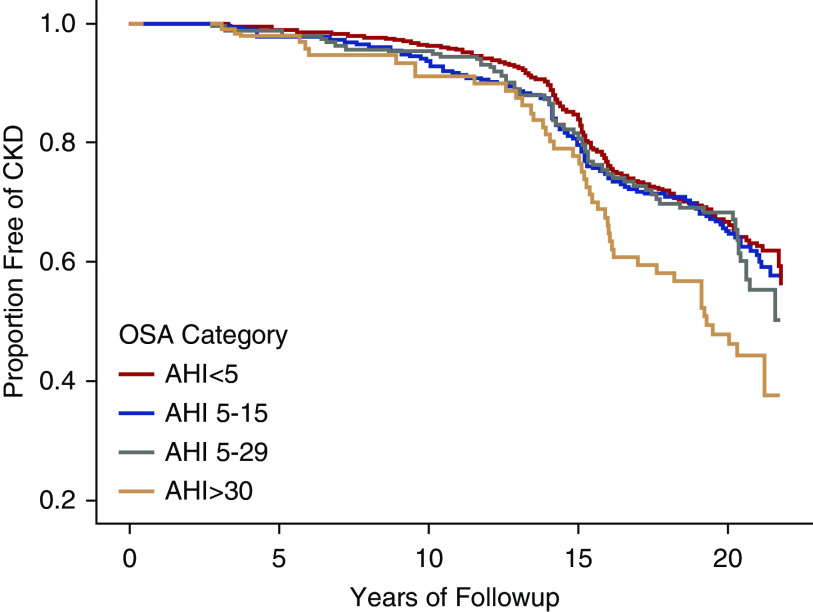
Figure 3.
Estimated probability of years free of CKD (stage ≥3) by OSA severity adjusted for age and sex in the ARIC-SHHS study (n=1525). Kaplan–Meier curves depict the estimated probability of years free of CKD by OSA severity. Log rank test show that risk of CKD significantly differed by OSA severity (P<0.01).

