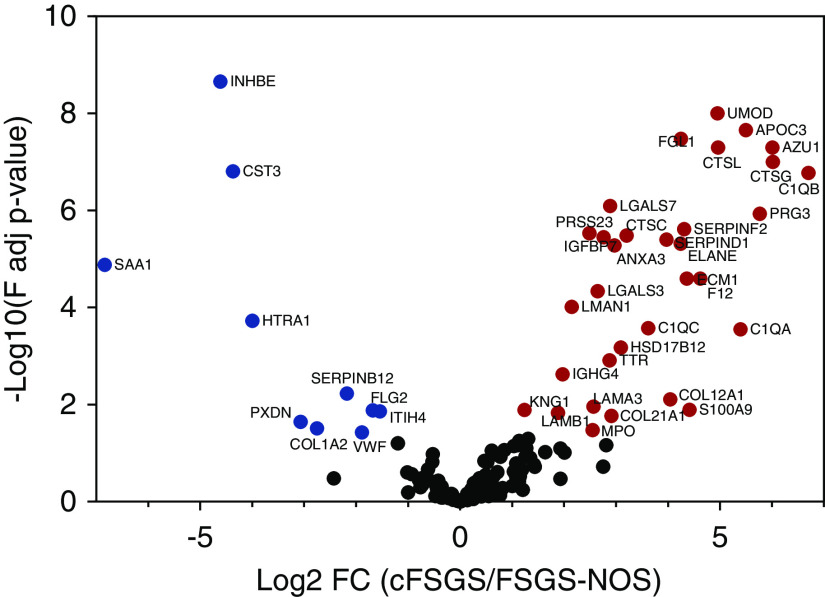
Figure 1.
Volcano plot shows significant differences in glomerular ECM protein expression between cFSGS and FSGS-NOS. Of 166 proteins, abundance of 42 proteins differed by ANOVA analysis with Benjamini–Hochberg correction for multiple comparisons (adjusted P<0.05). The y axis is defined as the −log10 multiple comparisons adjusted P value (F adj P-value) and the x axis defined as the log2 fold change (Log2 FC) of ECM protein abundance in isolated glomeruli from patients with cFSGS (n=7), compared with those with FSGS-NOS (n=6). Red symbols denote increased abundance in cFSGS for 32 proteins. Blue symbols denote increased abundance in FSGS-NOS for ten proteins. Symbols denoting differentially abundant proteins are annotated by gene name.

