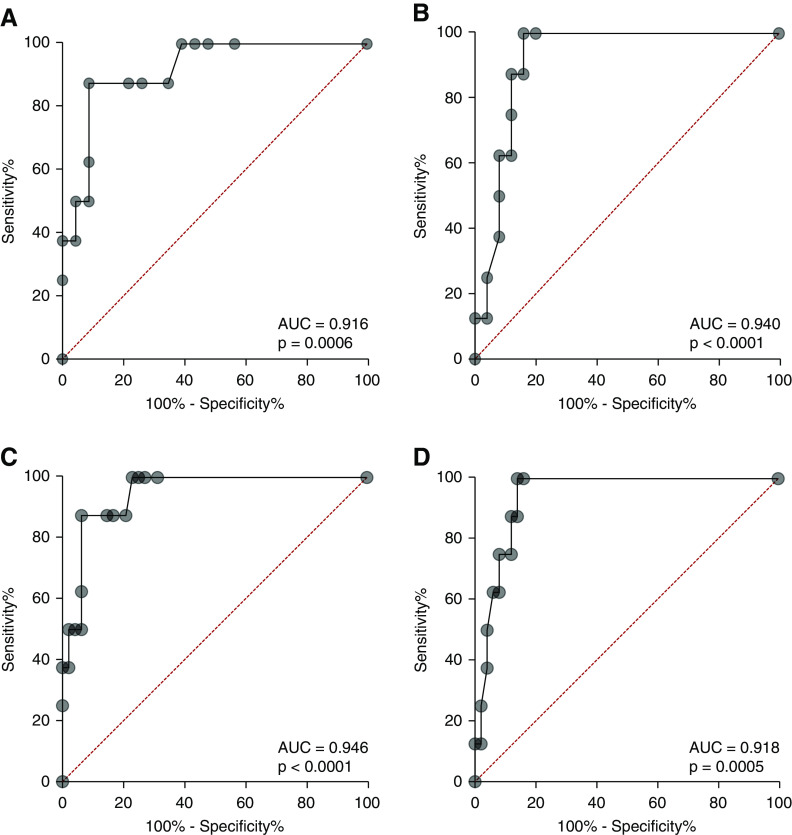
Figure 8.
Receiver operating characteristic (ROC) curves showing glomerular tuft staining for cathepsin C and annexin A3 predict cFSGS. ROC plots showing predictive capability of the percentage of glomeruli with tuft staining for cathepsin C or annexin A3. (A) The ROC curve for the percentage of glomeruli with cathepsin C staining of glomerular tufts comparing cFSGS to all other variants of FSGS. (B) The ROC curve for percentage of glomeruli with annexin A3 staining of glomerular tufts comparing cFSGS to all other variants of FSGS. (C) The ROC curve for the percentage of glomeruli with cathepsin C staining comparing cFSGS with other FSGS variants, MCD, and MN. (D) The ROC curve for annexin A3 staining comparing cFSGS with other FSGS variants, MCD, and MN. The AUC analysis and P value are in the box accompanying each panel. Patients with cFSGS had a mean±SEM serum creatinine of 3.81±0.67 mg/dl and mean±SEM urine protein excretion of 9.54±1.97 mg/24 h. Patients with the other variants had a mean±SEM serum creatinine of 1.82±0.24 mg/dl and mean±SEM urine protein excretion of 8.1±1.95 gm/24 h.

