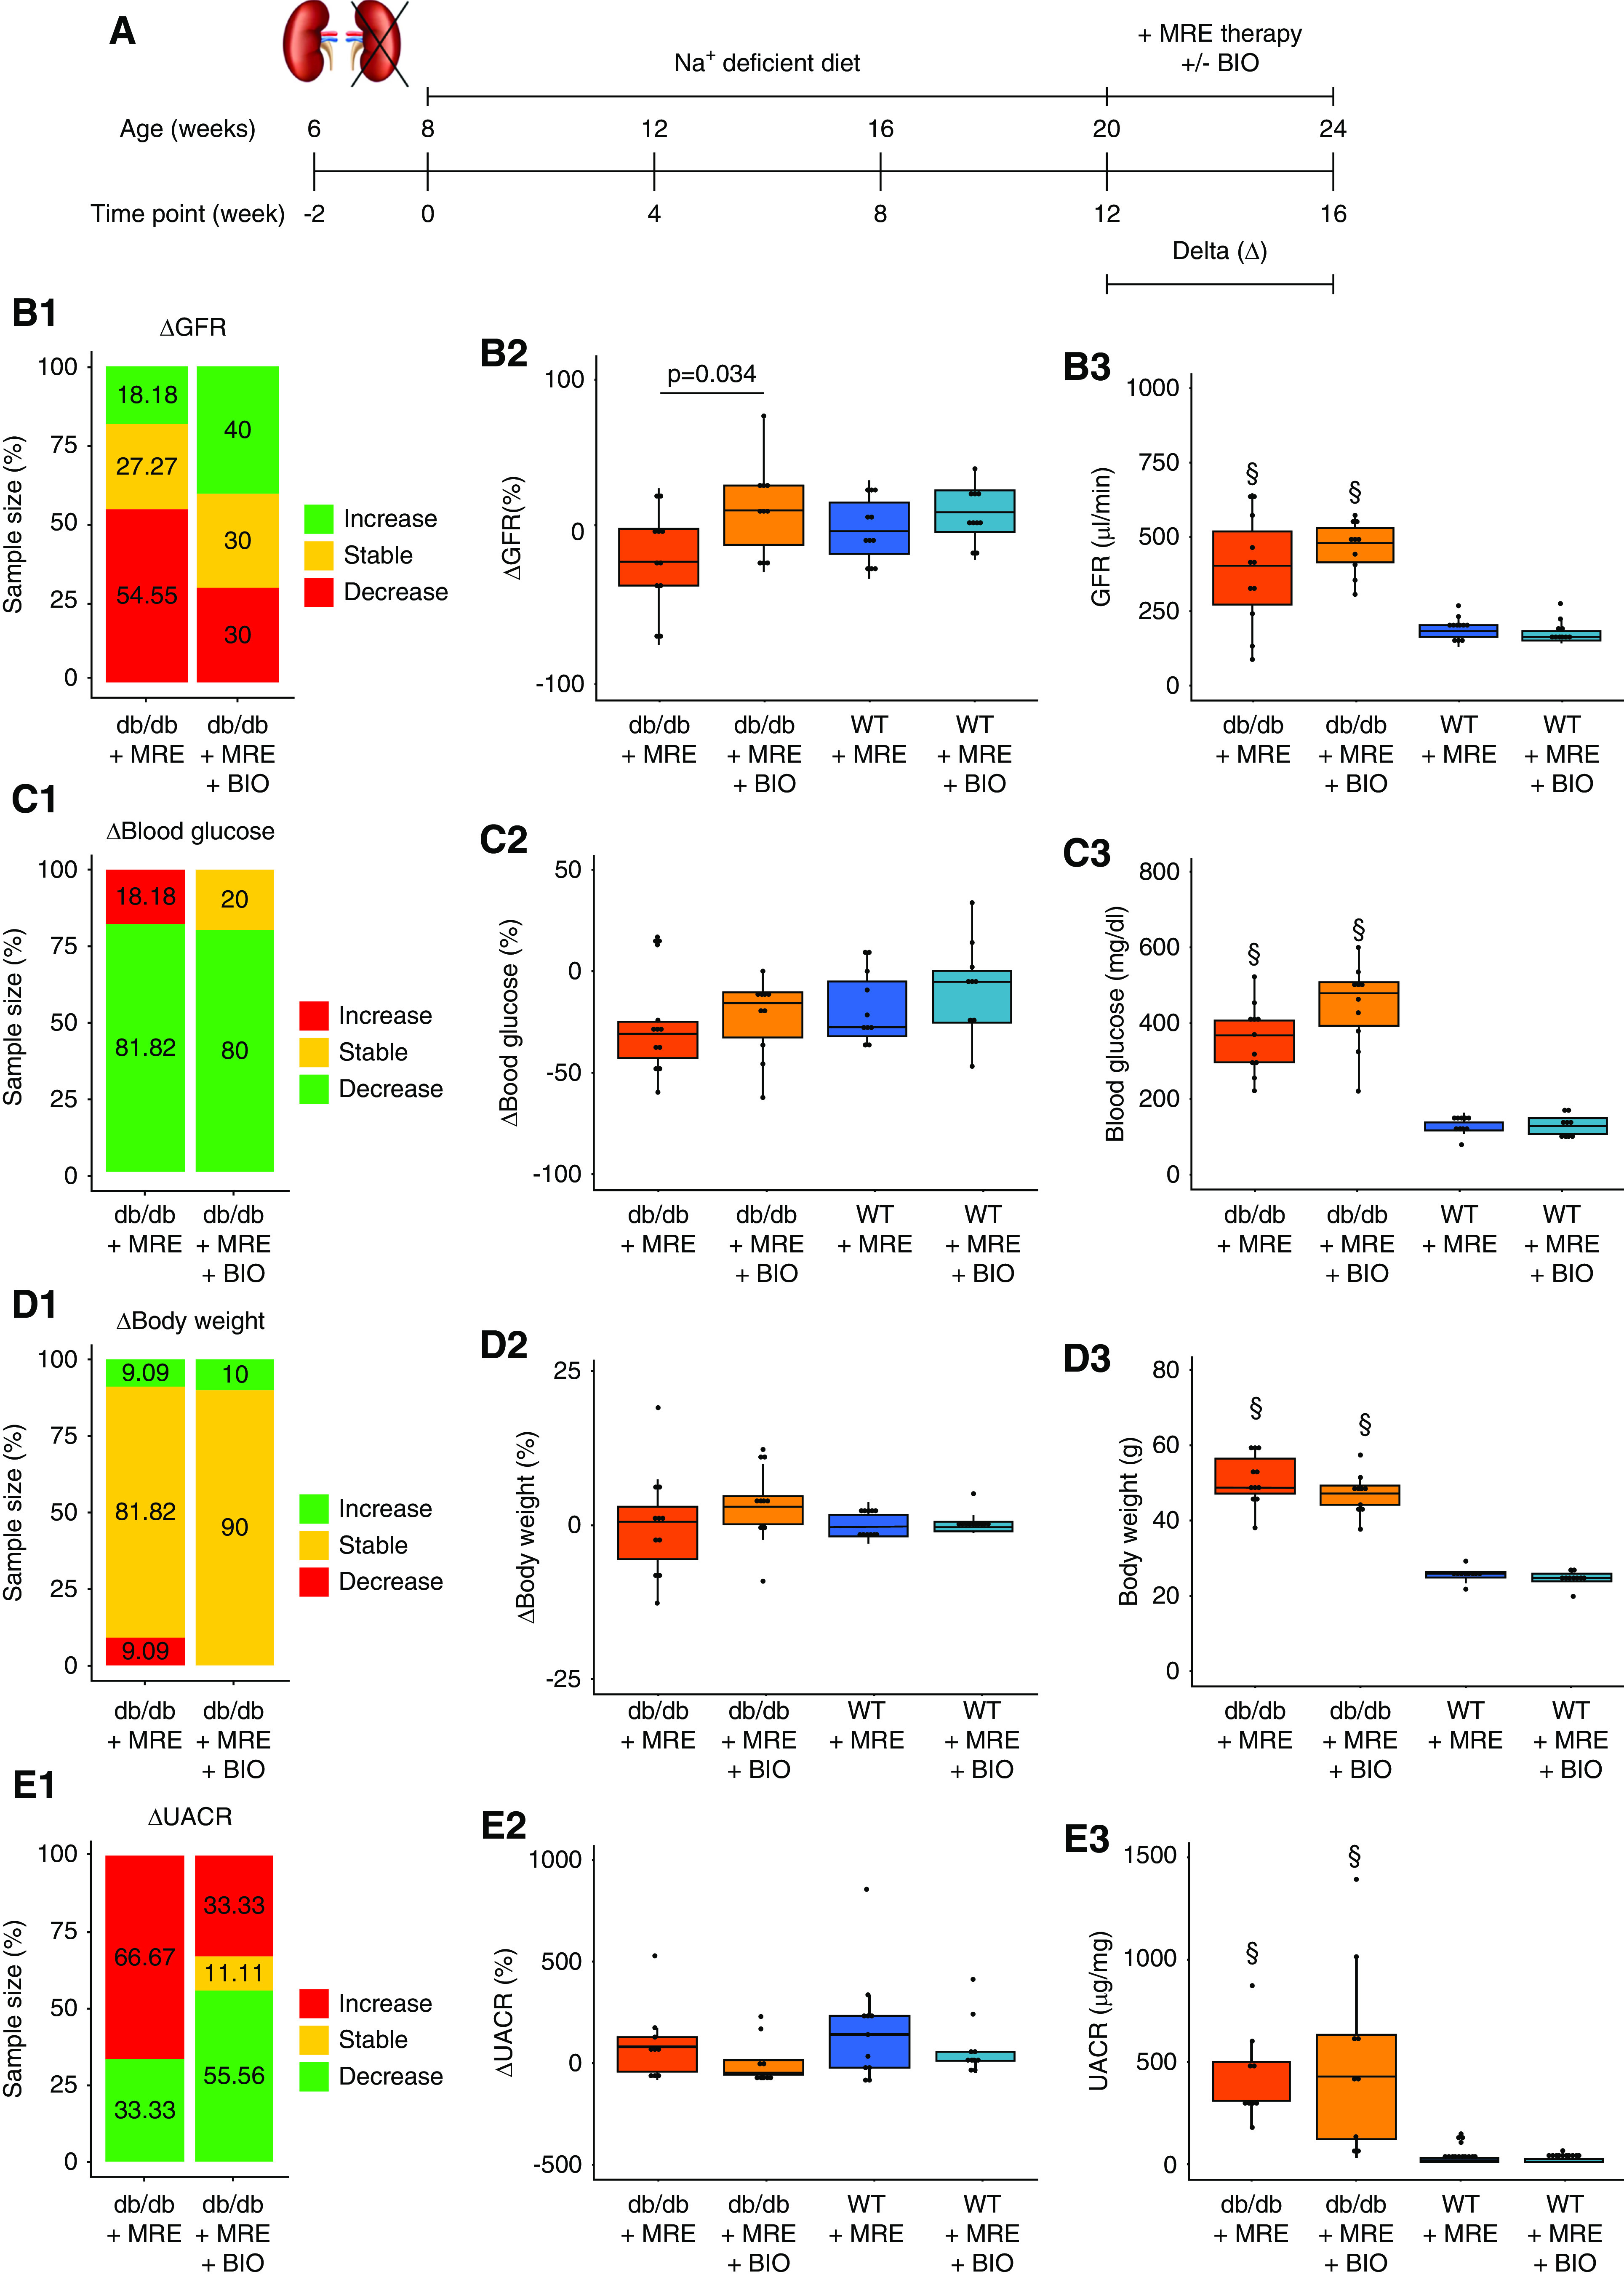
Figure 5.

Effect of combined MRE+BIO therapy on primary and secondary outcomes. (A) Schematic representation of the experiment to assess the effect of combined MRE+BIO therapy versus MRE therapy alone. Uninephrectomized mice were treated with MRE therapy (included in the sodium-deficient diet) or MRE+BIO (2 µmol/kg, subcutaneously) from weeks 12 to 16. (B) GFR assessment. (B1) ΔGFR classification, expressed as the variation in GFR from weeks 12 to 16. Mice were classified as having an increase in GFR (>10%, green), a stable GFR (±10%, yellow), or a decrease (<10%, red) between the two time points indicated. The percentage of mice in each of these groups is specified in the stacked bar graph. (B2) ΔGFR values, expressed as the percentage of variation in GFR from weeks 12 to 16. (B3) GFR at end point (week 16). (C) Blood glucose assessment. (C1) Δ Blood glucose classification, expressed as the variation in blood glucose levels from weeks 12 to 16. Mice were classified as having an increase in blood glucose (>10%, red), stable levels (±10%, yellow), or a decrease (<10%, green) between the two time points indicated. The percentage of mice in each of these groups are specified in the stacked bar graph. (C2) Δ Blood glucose values, expressed as the percentage of variation in blood glucose from weeks 12 to 16. (C3) Blood glucose levels at end point (week 16). (D) Body weight assessment. (D1) Δ Body weight classification, expressed as the variation in body weight from weeks 12 to 16. Mice were classified as having an increase in body weight (>10%, green), stable weight (±10%, yellow), or a decrease (<10%, red) between the two time points indicated. The percentage of mice in each of these groups is specified in the stacked bar graph. (D2) Δ Body weight values, expressed as the percentage of variation in body weight from weeks 12 to 16. (D3) Body weight at end point (week 16). (E) UACR assessment. (E1) ΔUACR classification, expressed as the variation in UACR from weeks 12 to 16. Mice were classified as having an increase in UACR (>10%, red), stable levels (±10%, yellow), or a decrease (<10%, green) between the two time points indicated. The percentage of mice in each of these groups is specified in the stacked bar graph. (E2) ΔUACR values, expressed as the percentage of variation in UACR from weeks 12 to 16. (E3) UACR levels at end point (week 16). §P value≤0.05 versus respective WT group. Statistical analyses performed are summarized in Supplemental Table 4.
