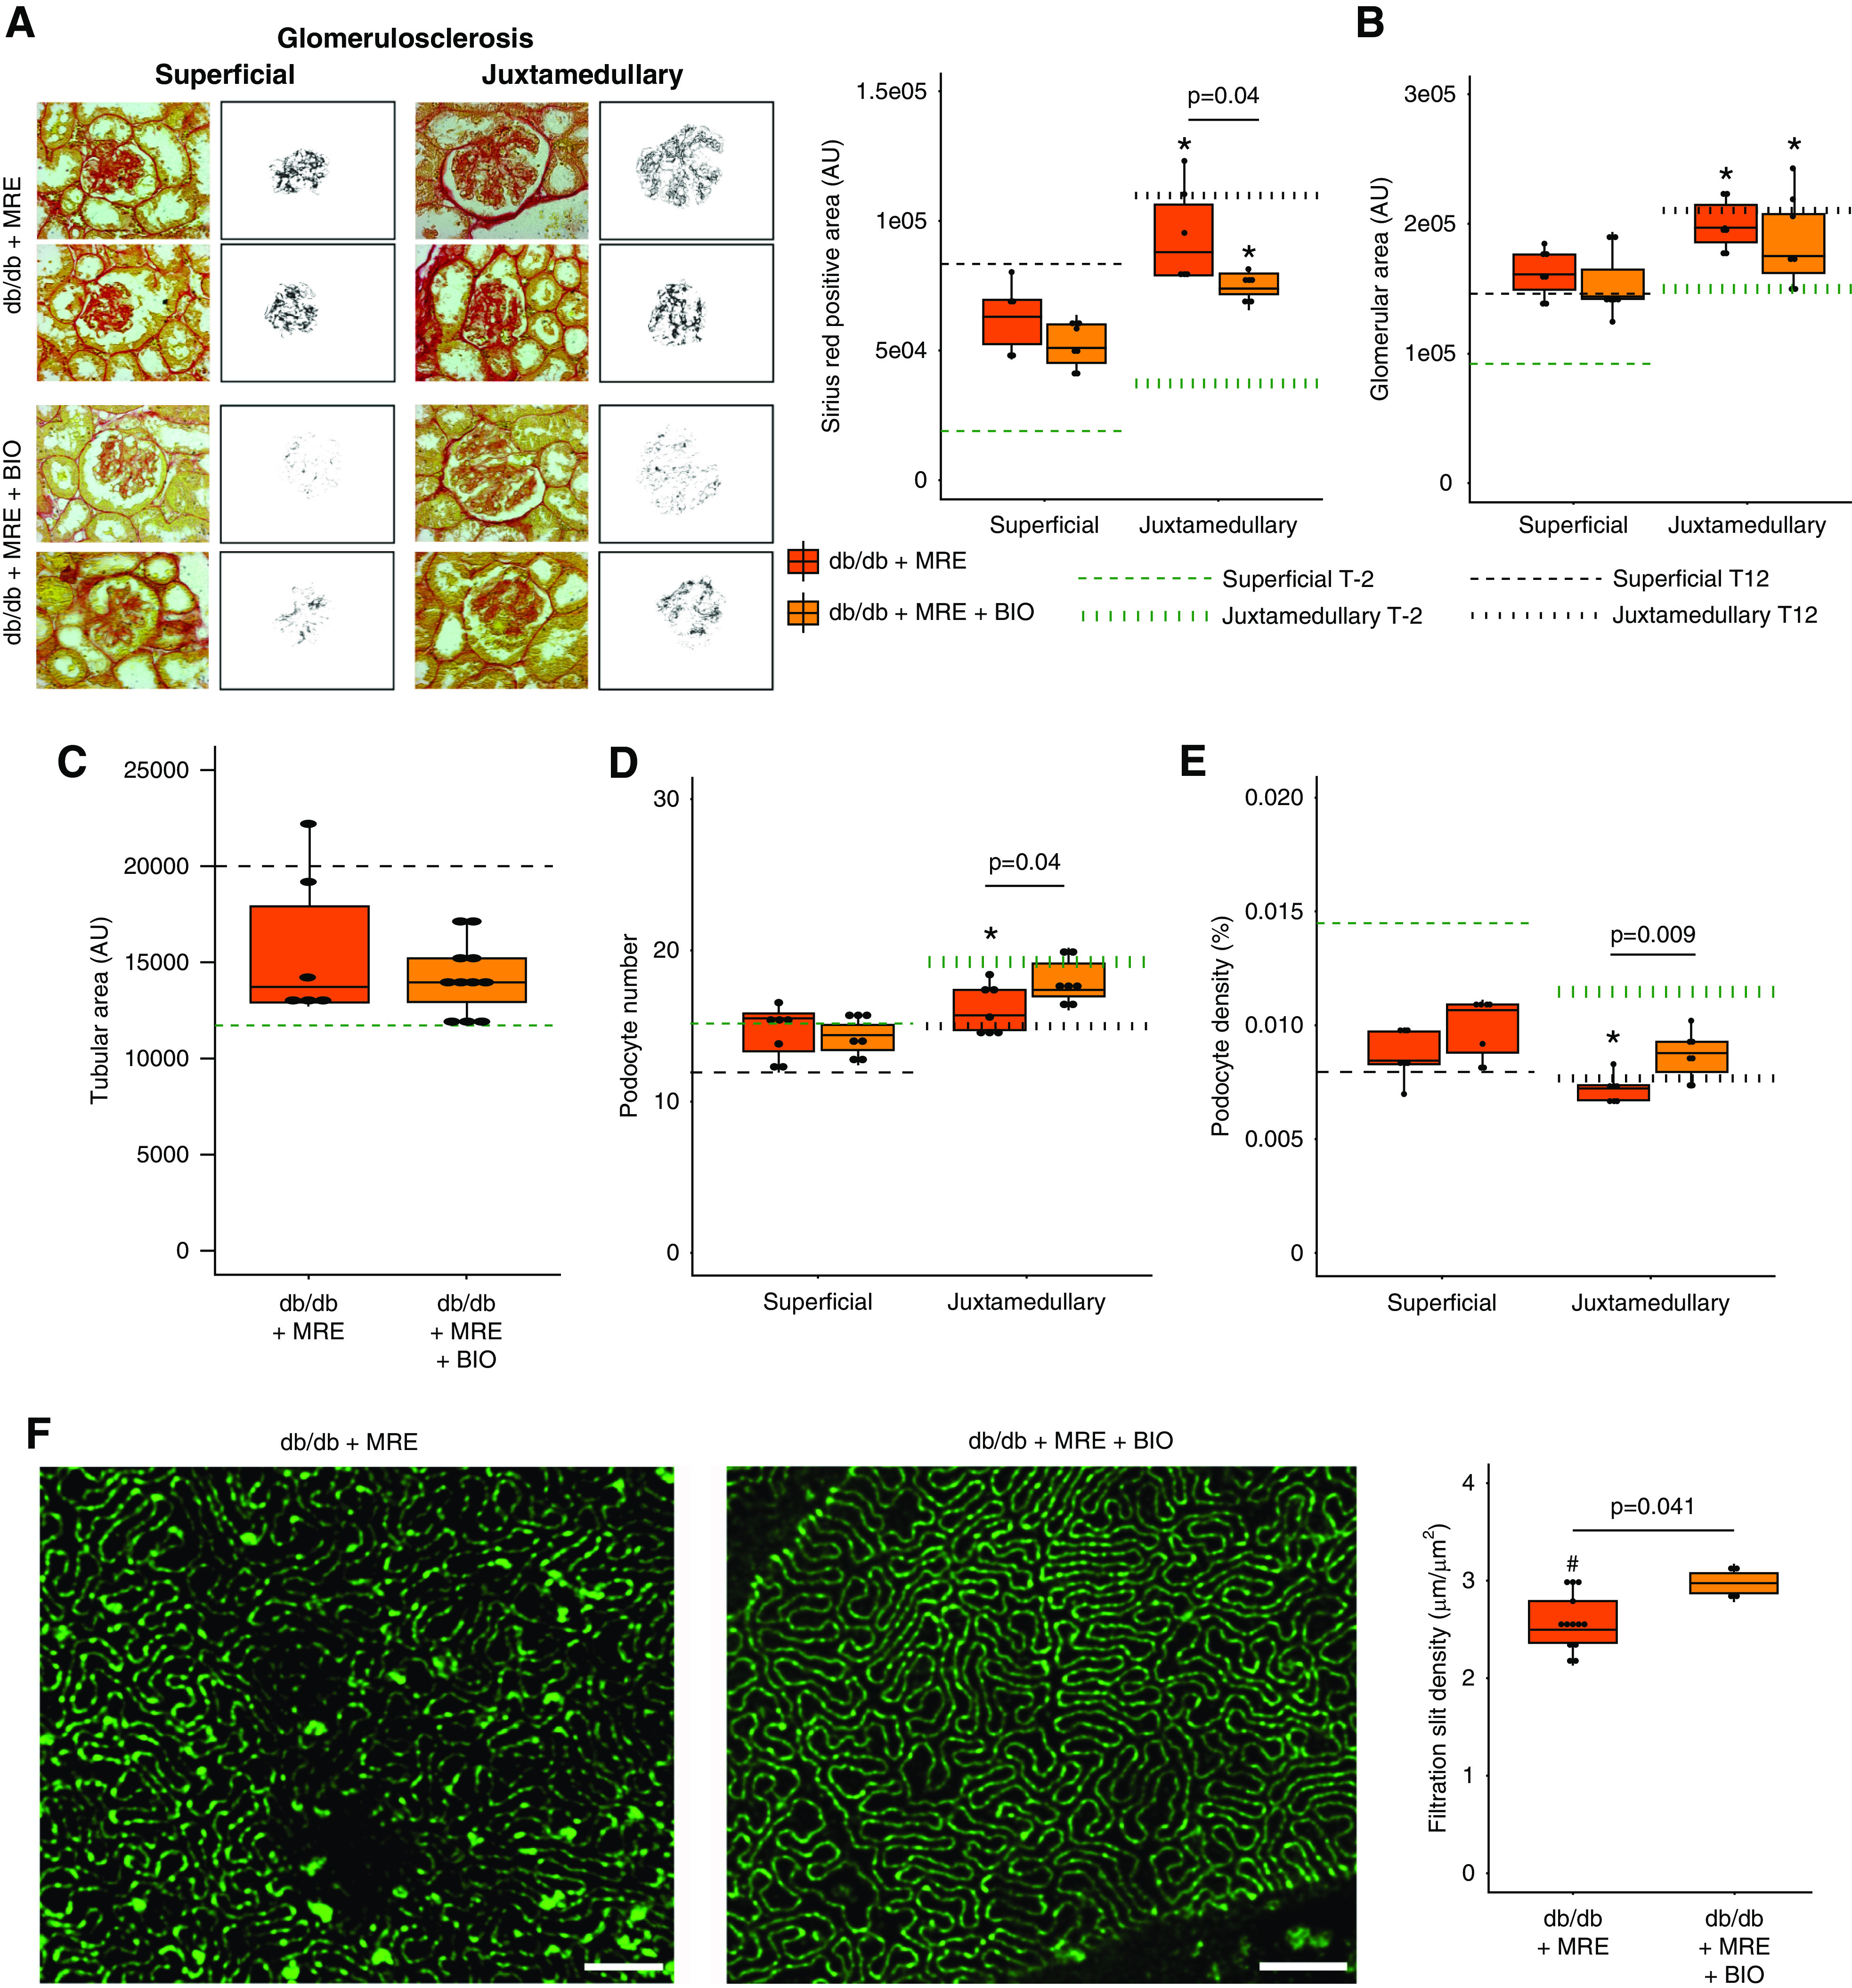
Figure 6.

Effect of combined MRE+BIO therapy on histologic outcomes at end point. (A) Glomerulosclerosis, measured as Picro-Sirius Red-positive area (AU). Magnification, ×40. (B) Glomerular area, measured as the glomerular tuft area (AU) in PAS sections. (C) Tubular size, assessed in Picro-Sirius Red sections. (D) Podocyte number, assessed in WT-1 sections. (E) Podocyte density, calculated as the number of podocytes per glomerular tuft area. In (A–D), dotted green lines represent the levels at baseline (week −2) from each histologic assessment. Dotted black lines represent the levels before starting the treatment (week 12). In addition, both superficial and juxtamedullary nephrons were assessed independently, and the average number of glomeruli quantified are summarized in Supplemental Table 2. (F) Filtration slit density. Density of filtration slit was assessed as a marker of terminal podocyte differentiation by using STED-super resolution microscopy upon tissue clearing. The quantification was carried out for five randomly selected areas for each glomerulus of at least five glomeruli per mouse. Bars, 2 µm. Magnification, ×100. *P value≤0.05 versus respective superficial glomeruli. Statistical analyses performed are summarized in Supplemental Table 4. AU, arbitrary units.
