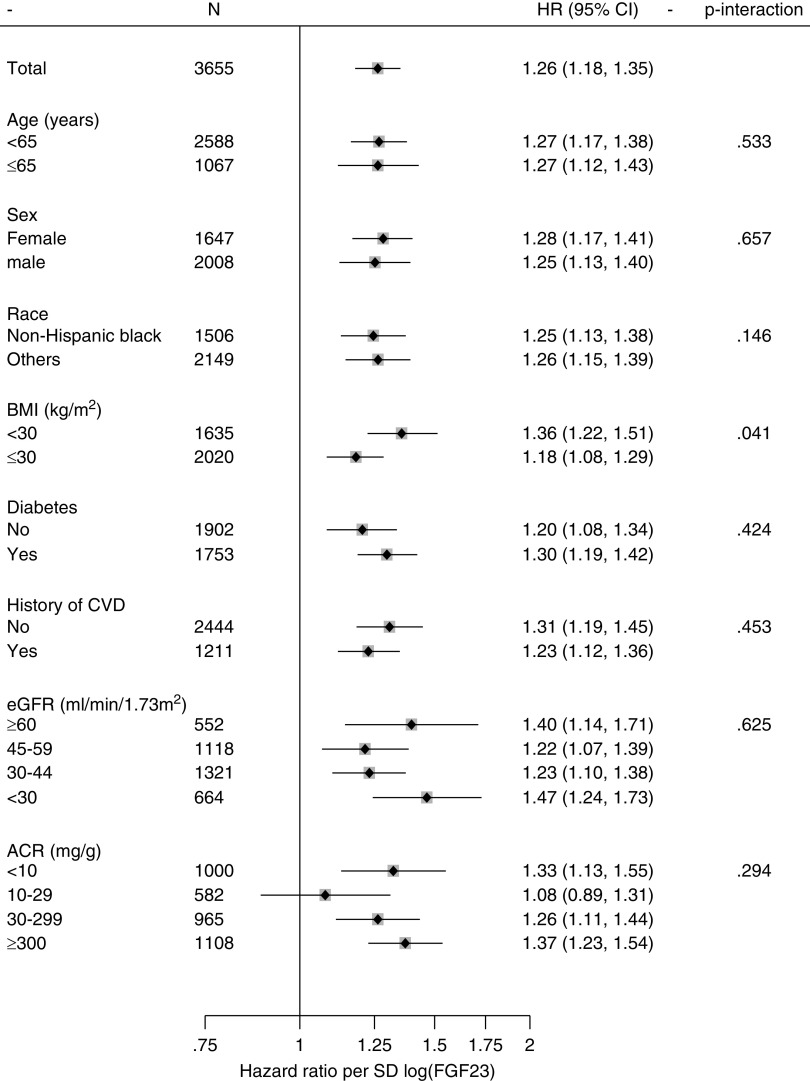
Figure 2.
Subgroup analysis for adjusted HRs of hospitalization with infection for FGF23, CRIC study 2003–2013. The association was generally consistent across subgroups by age, sex, race/ethnicity, body mass index, diabetes, history of cardiovascular disease, eGFR, and ACR. Diamonds in square represent point estimates for HRs per SD increment in log FGF23. Models were stratified by center and adjusted for age, sex, race, body mass index, smoking status, alcohol consumption, hypertension, diabetes, chronic obstructive pulmonary disease, cancer, cardiovascular disease, eGFR, and ACR. Horizontal lines represent the range for 95% CIs. BMI, body mass index; CVD, cardiovascular disease.

