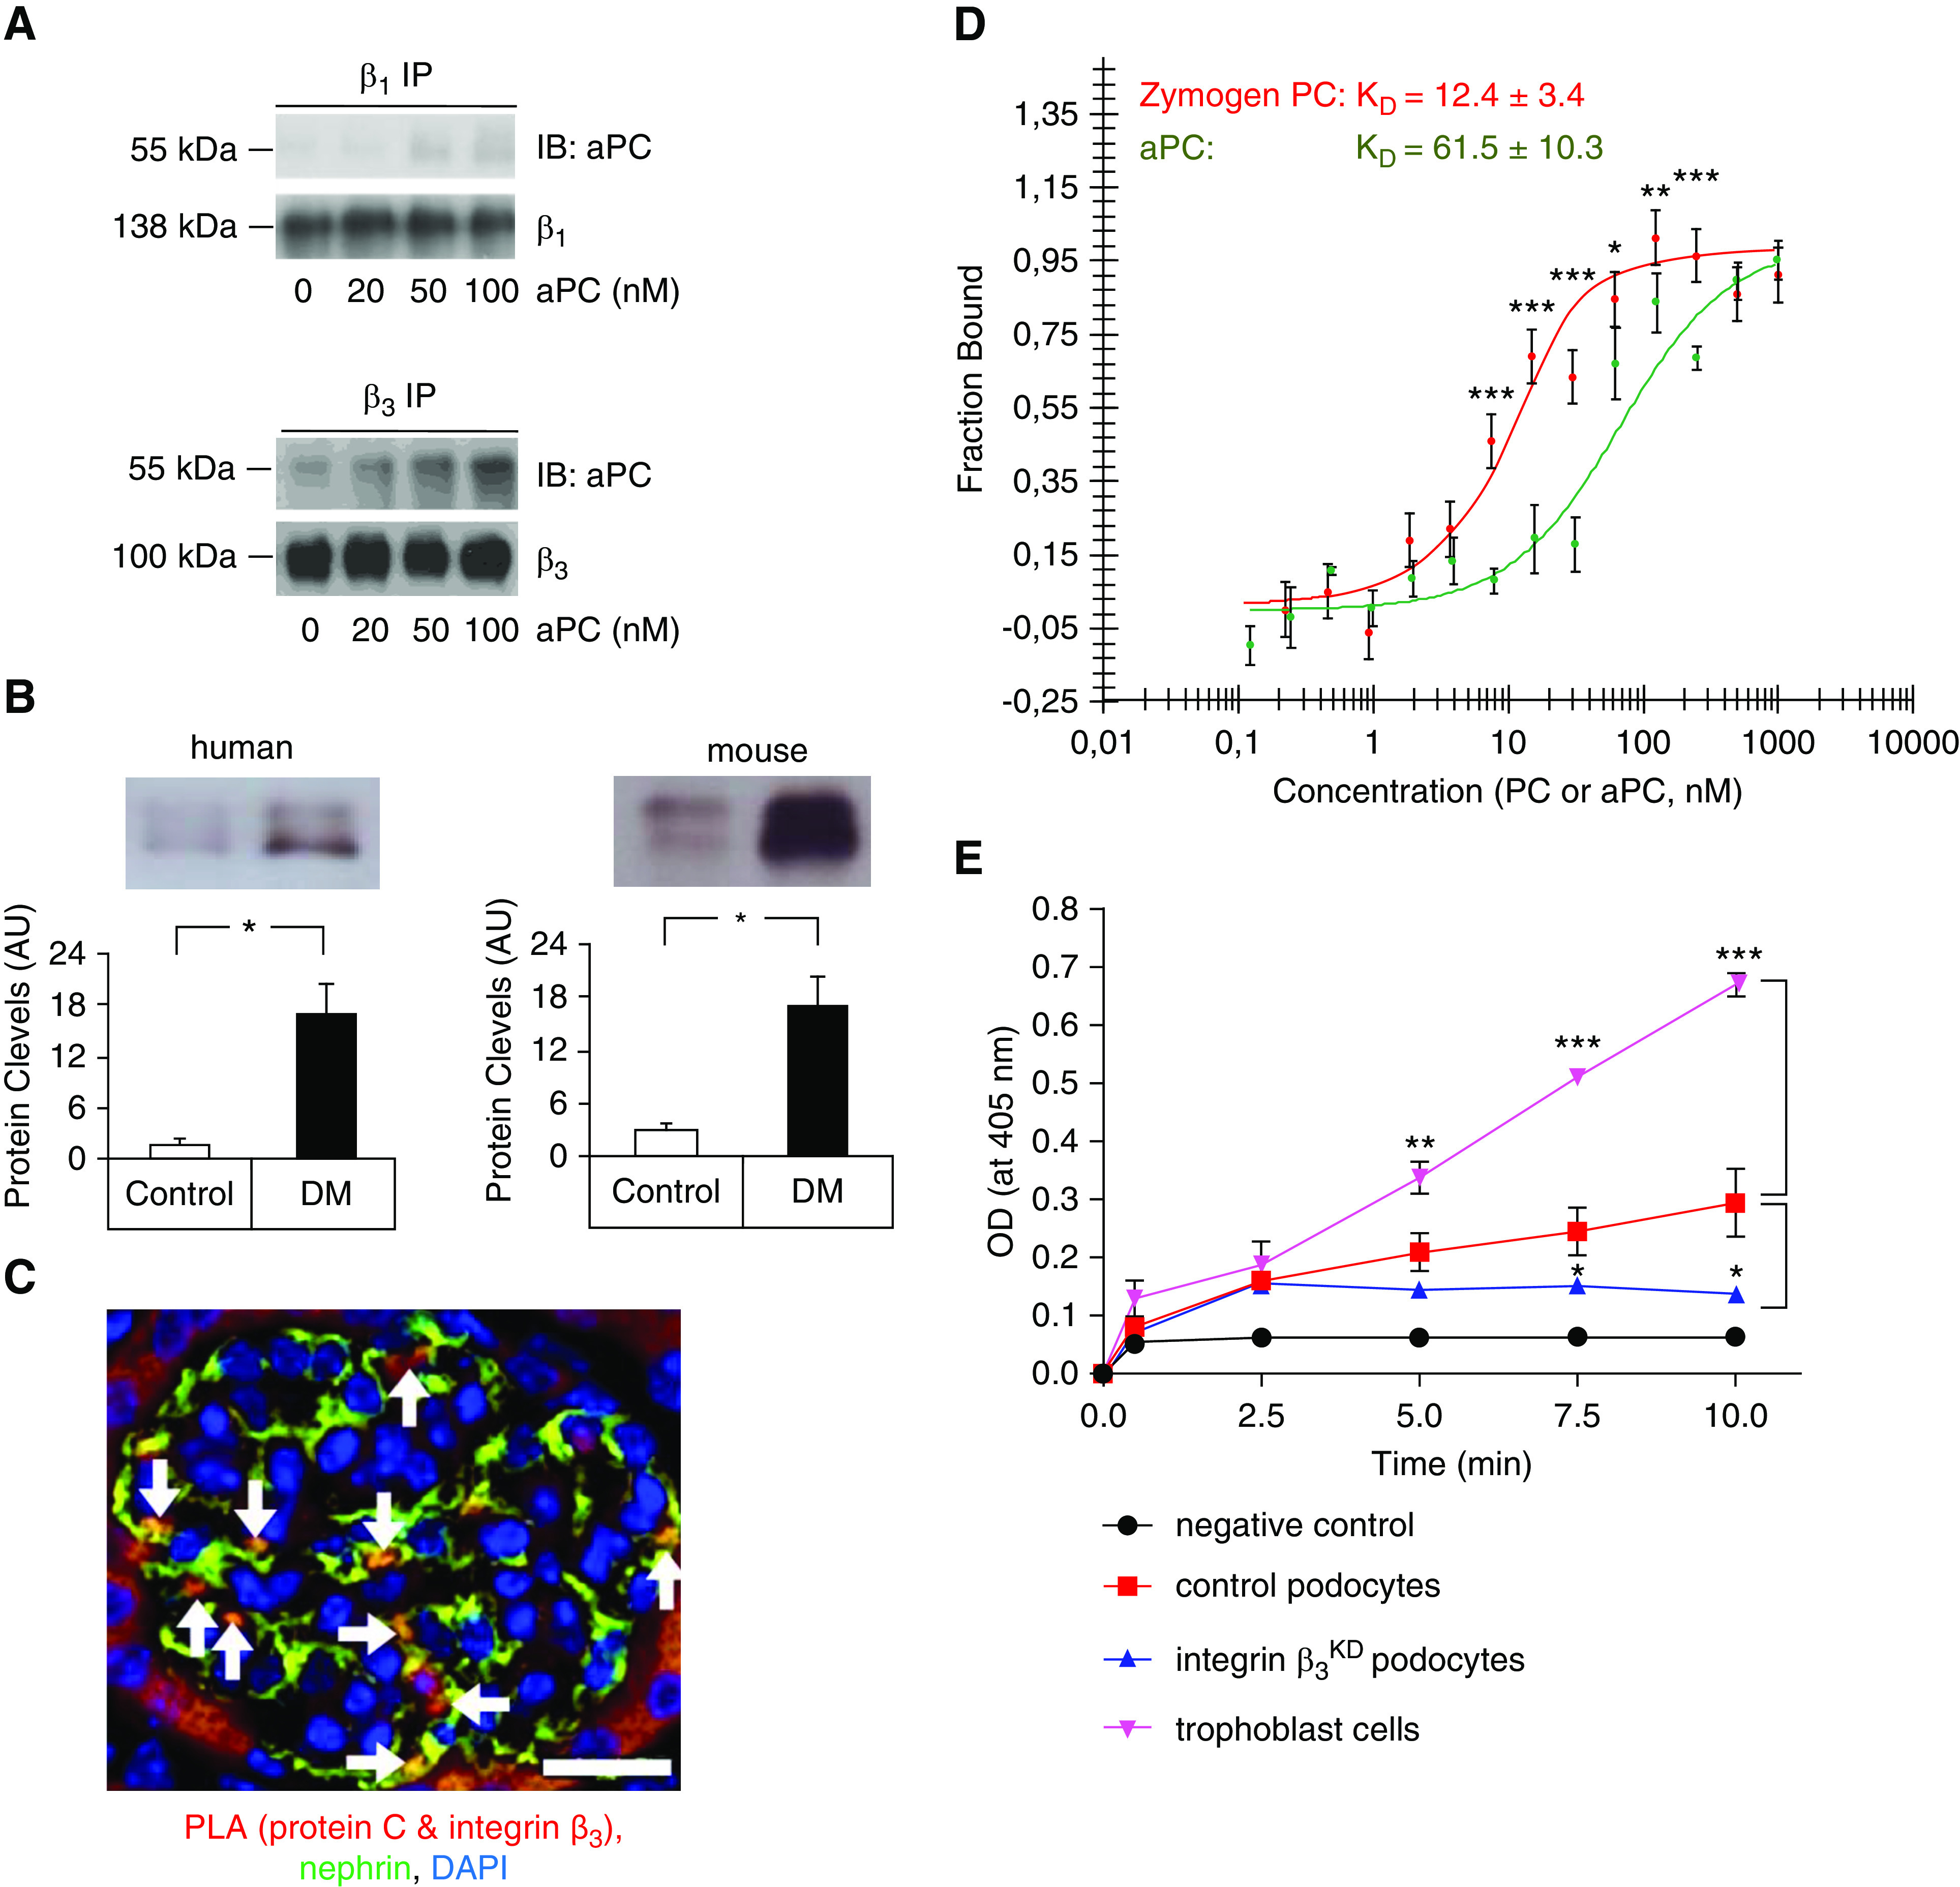
Figure 2.

The PC–integrin-αvβ3 interaction enhances aPC generation in podocytes. (A) Representative immunoblot images of aPC (55 kDa, top) after immunoprecipitation of integrin-β1 (β1 IP, left, 138 kDa) or integrin-β3 (β3 IP, right, 100 kDa) in human podocytes. Human aPC binds in particular to integrin-β3 on human podocytes; the antibody used to detect aPC recognizes both the zymogen and the activated form. The lower gel shows the loading control (integrin-β1 or integrin-β3). The concentration of aPC is shown at the bottom in nanomolar, and the incubation time was 10 minutes. (B and C) Experimental evidence that PC/aPC is glomerularily filtered and interacts with β3 integrin on podocytes. (B) PC is detectable in the urine of nondiabetic humans and mice (control) and markedly increases in patients with diabetes (DM) and diabetic mice (db/db mice, DM). Representative immunoblot images and bar graph summarizing results of at least five humans or mice per group. *P<0.05, t test comparing DM versus control. (C) Representative image, showing colocalization (yellow, white arrows) of the PC–integrin-β3 complex (red, detected by PLA) with nephrin (green, podocyte marker, immunofluorescence staining) in mouse kidney sections. Scale bar, 20 μm. (D) Binding of the serine protease aPC (green) or the zymogen PC (red) to integrin-αvβ3 as analyzed by microscale thermophoresis. The data are presented as the mean±SEM for three independent repeat experiments. *P<0.05, **P<0.01, ***P<0.005 comparing PC versus aPC; t test with Bonferroni correction. (E) Cell-based in vitro aPC generation assay. Thrombin (10 nM)-mediated PC activation was determined in the presence of trophoblast cells (positive control, purple), control mouse podocytes (red), or integrin-β3–deficient (integrin-β3KD, blue) podocytes. aPC generation in the absence of cells served as a negative control (black). The data are presented as the mean±SEM for three independent repeat experiments. Comparative results were obtained with an independent integrin-β3KD cell line. *P<0.05, **P<0.01, ***P<0.005 versus control podocytes; one-way ANOVA with Bonferroni-adjusted post hoc comparison of trophoblast cells or integrin-β3KD podocytes with control podocytes.
