Figure 3.

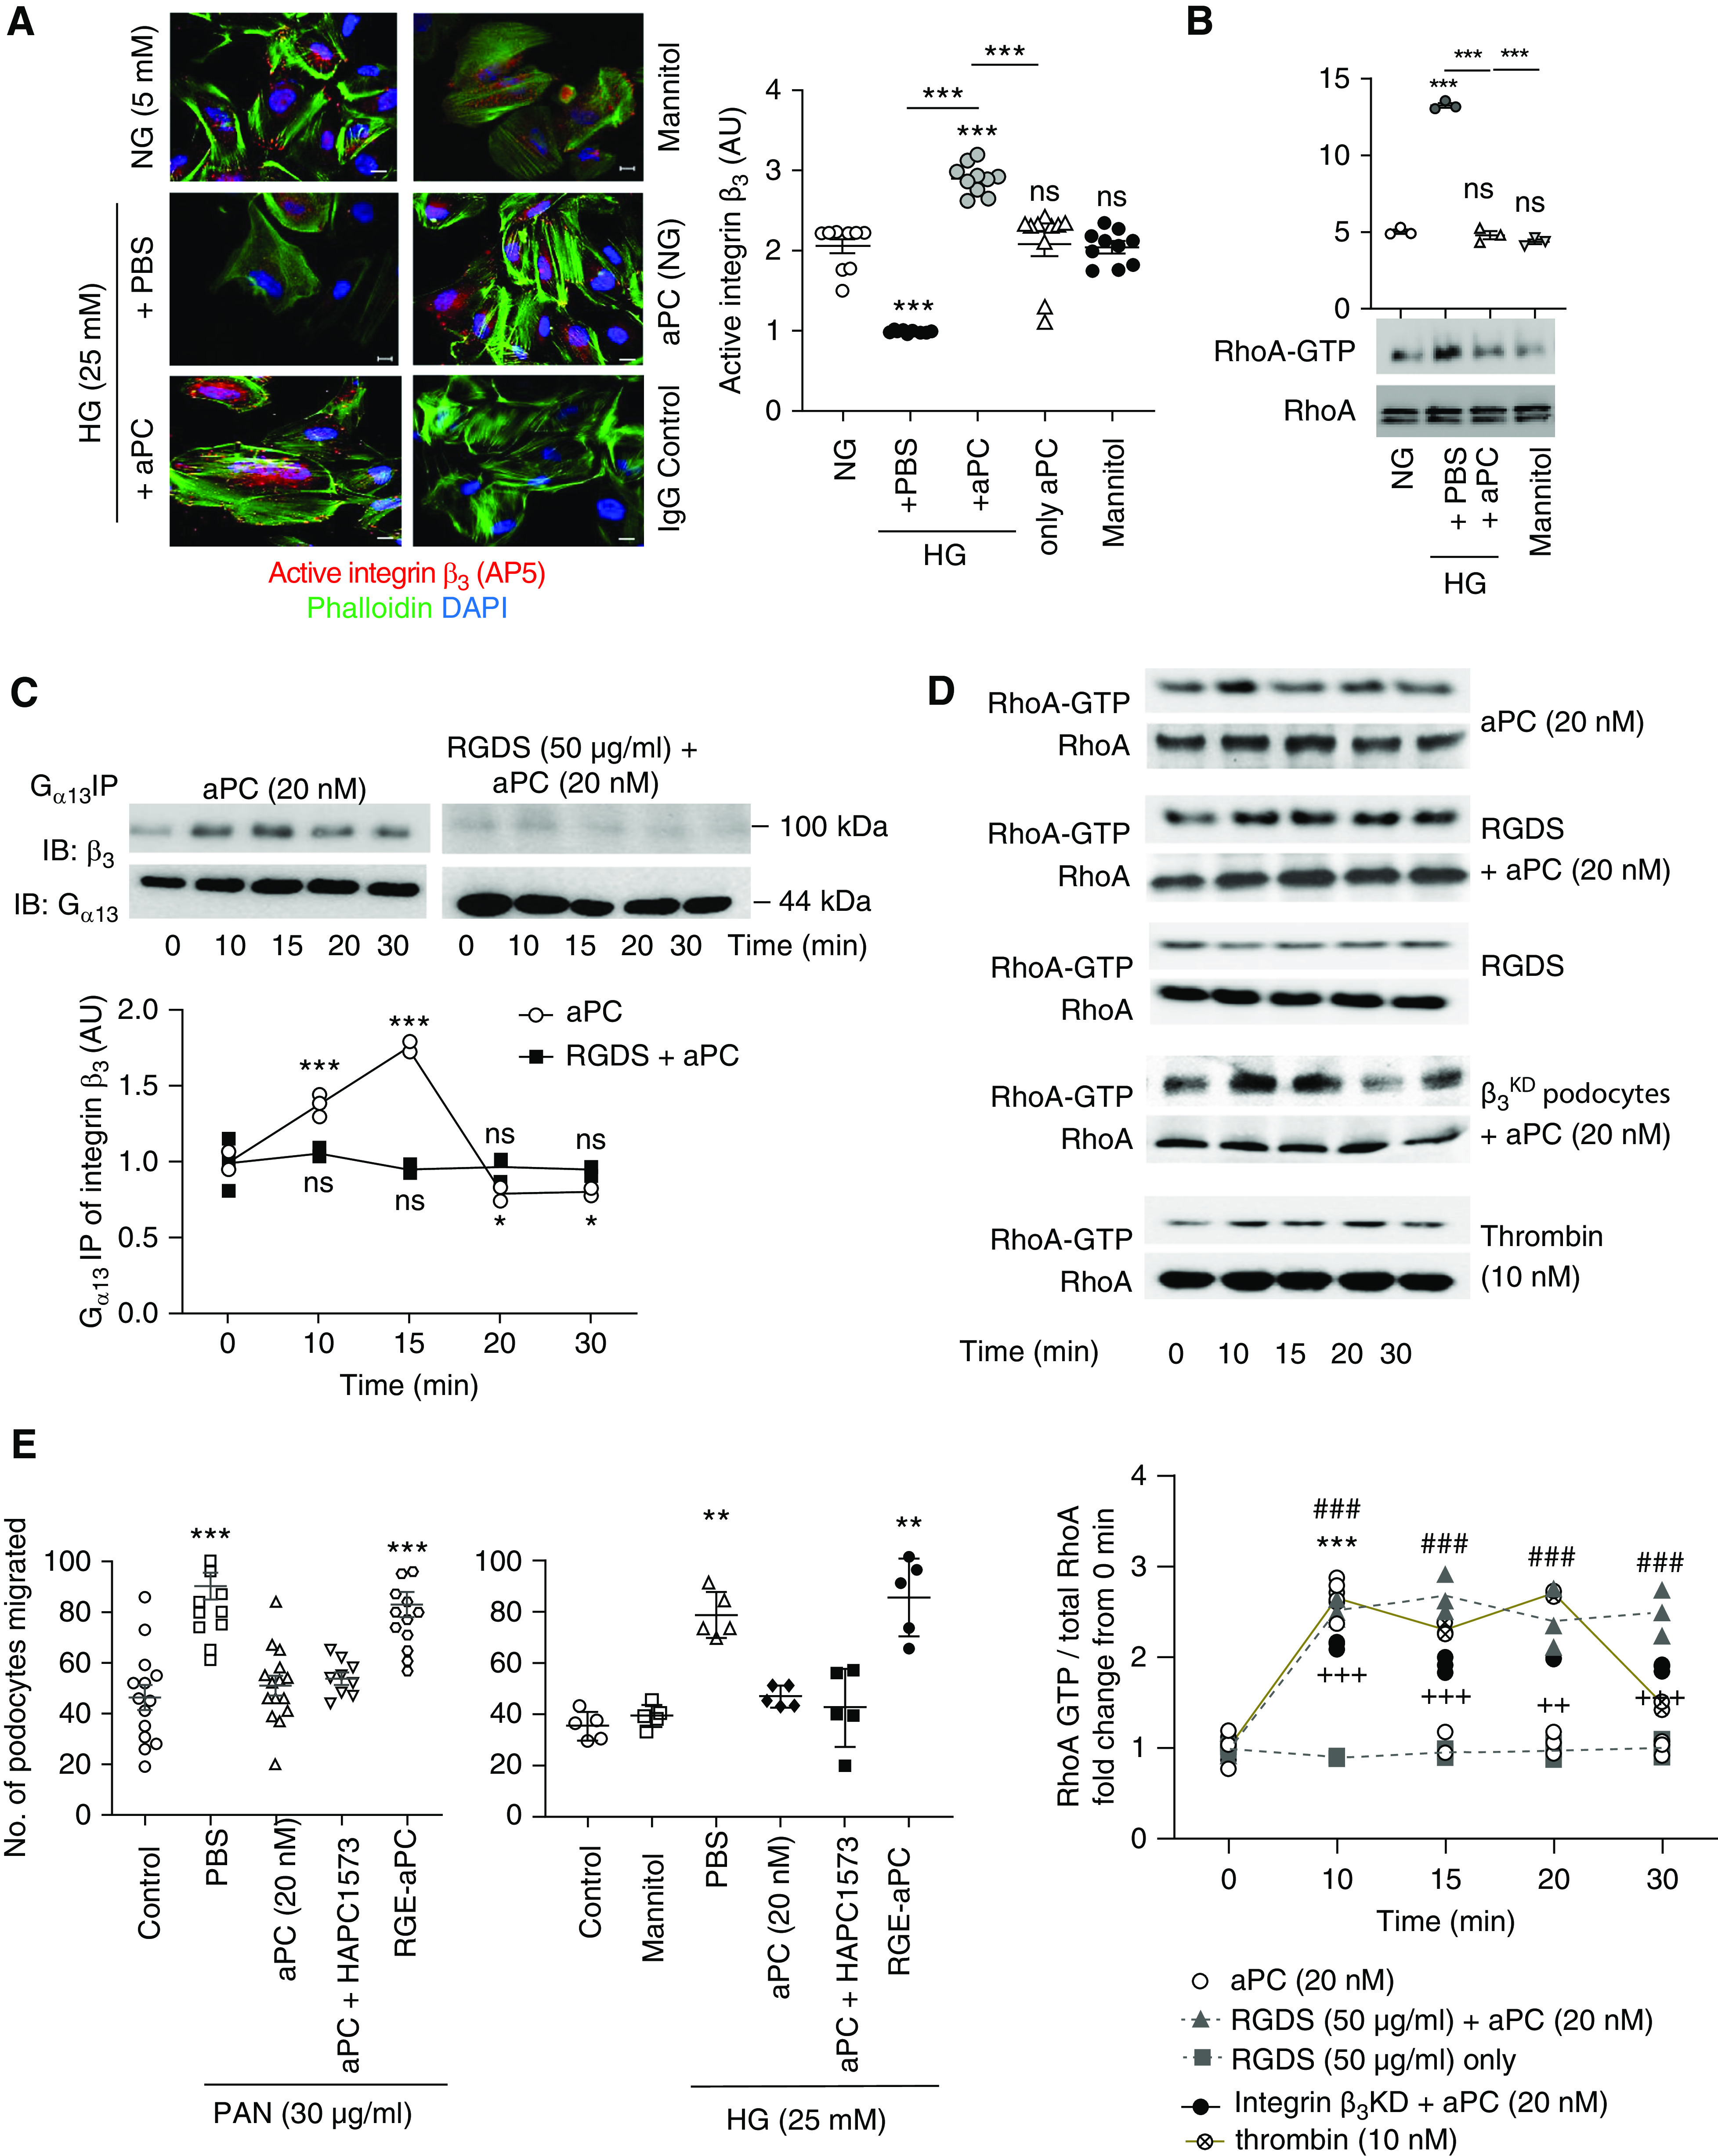
aPC–integrin-αvβ3 temporally regulates RhoA activation in podocytes. (A) Representative immunofluorescence images (left) of active integrin-β3, as determined by the conformation-specific antibody AP5, in human podocytes without (normal glucose concentration, 5 mM glucose, NG) or with high glucose (HG, 25 mM) stimulation in the absence (PBS) or presence of aPC (20 nM). Mannitol is used as an osmotic control. Cells stained with nonspecific IgG served as staining controls. The dot plot at the right summarizes the results. All groups were compared with control and HG+PBS to HG+aPC. Scale bar, 20 μm. (B) Representative immunoblot images showing levels of RhoA-GTP (21 kDa) and total RhoA (21 kDa) obtained from the RhoA pull-down assay and dot blot summarizing the data. Compared with control (5 mM glucose, NG) and the osmotic control mannitol (25 mM), high glucose concentrations (25 mM, HG, 3 hours) induce RhoA activation in human podocytes, which is prevented by concomitant exposure to aPC (aPC, 20 nM). (C) Representative integrin-β3 immunoblot images (top; IB: β3) of Gα13 immunoprecipitate showing time-dependent interaction of Gα13 with integrin-β3 upon stimulation of human podocytes with aPC. Gα13 (44 kDa) immunoblots were used as loading controls (top; IB: Gα13). Preincubation of cells with RGDS abolished the aPC-induced time-dependent interaction of Gα13 with integrin-β3. The line graph summarizes the results from three repeat experiments (bottom), with each dot representing an individual measurement. All groups were compared with control. (D) Representative immunoblot images (top) showing the levels of RhoA-GTP (21 kDa) and total RhoA (21 kDa) obtained from the RhoA pull-down assay and line graphs summarizing the kinetic data (bottom). RhoA activation was transient (peaking at 10 minutes) in human podocytes stimulated with aPC only (aPC), whereas sustained RhoA activation over 30 minutes was observed in podocytes stimulated with aPC and RGDS (aPC+RGDS), in integrin-β3–deficient podocytes stimulated with aPC (after lentiviral short hairpin RNA–mediated knockdown of integrin-β3, aPC-β3KD), or in thrombin-stimulated podocytes. RGDS alone had no effect (RGDS). All groups were compared with control. (E) Dot plot summarizing how PAN or high glucose (HG, 25 mM) induced podocyte migration (as determined by scratch assay) after treatment with PBS (PBS, control), aPC, aPC preincubated with the antibody HAPC1573 (a mouse mAb that blocks aPC’s anticoagulant effect), or RGE-aPC. In addition, mannitol as an osmotic control is shown for the glucose stimulation experiment. All groups were compared with control. The data are shown as dots of at least three (A–D) or five (E) independent repeat experiments in the dot plot, including mean and SEM in (A, B, and E), or as dots representing individual data points from three independent repeat experiments in the line graphs in (C and D). *P<0.05, **P<0.01, ***P<0.005 (A, B, and E). ***P<0.005 (aPC versus time point 0 minute), ### P<0.005 (RGDS + aPC versus time point 0 minute), ++P<0.01, +++P<0.005 (integrin β3KD + aPC versus time point 0 minute) in D. (A, B, D, and E) one-way ANOVA with Tukey-adjusted post hoc comparison of treated cells with untreated cells (time point, 0 minute).
