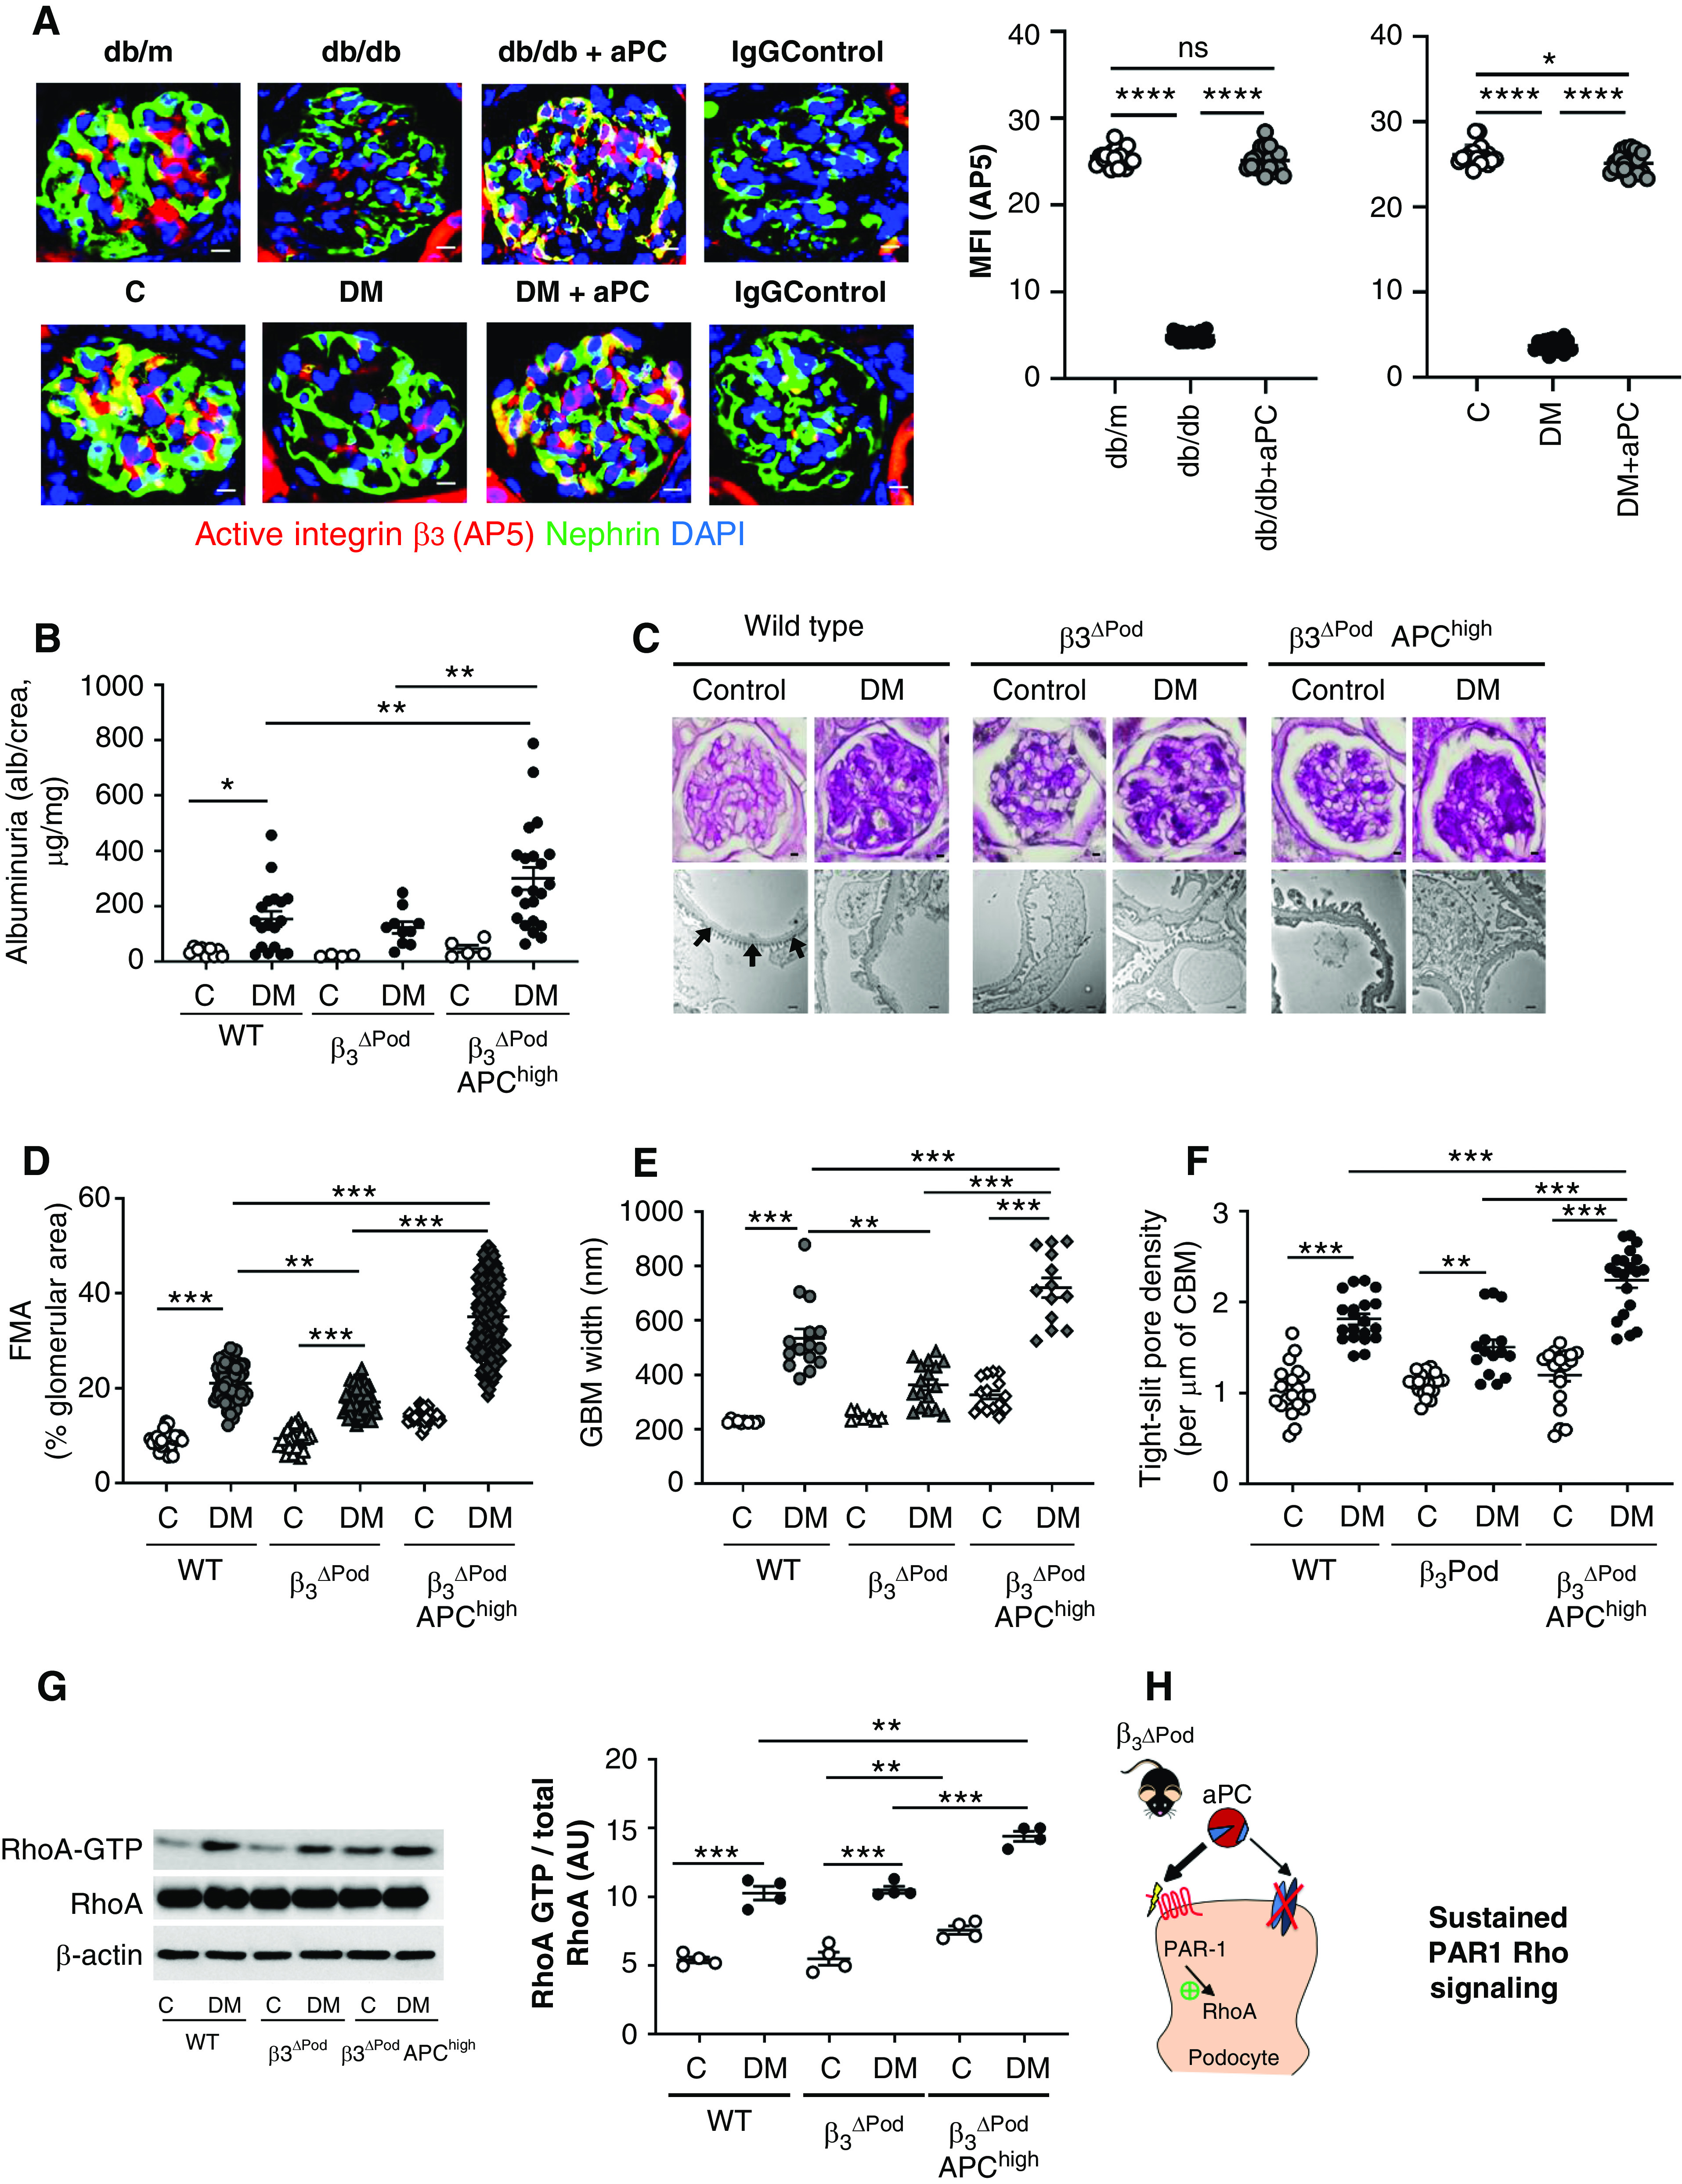
Figure 4.

Podocyte-specific deletion of integrin-β3 abrogates the cytoprotective effect of aPC in dNP. (A) Representative immunofluorescence images (left) of glomeruli of nondiabetic mice (db/m or control [C]), diabetic mice (db/db or STZ-induced diabetes [DM]), or diabetic mice treated with aPC (db/db+aPC or DM+aPC). The conformation-specific antibody AP5 was used to detect active integrin-β3 (red). Podocytes were identified by nephrin staining (green); yellow reflects the colocalization of AP5 and nephrin. The nuclei were stained with DAPI (blue). Dot plots summarizing the results are shown at the right. Diabetic mice without or with aPC treatment were compared with nondiabetic control mice (db/m or C) and among each other (db/db versus db/db+aPC and DM versus DM+aPC). Scale bar, 10 μm. (B) Dot plot summarizing urine albumin levels (the albumin-creatinine ratio) in control (C) and diabetic (DM) wild-type (WT) mice, β3ΔPod mice and β3ΔPod mice crossed with APChigh mice (β3ΔPod APChigh). (C) Representative images of glomeruli (top; PAS staining of paraffin-fixed sections; scale bar, 5 μm) and the glomerular filtration barrier (bottom, transmission electron microscopy; scale bar, 0.2 μm) and dot plots summarizing (D) the data for the FMA, (E) the width of the GBM (representative of arrows in the far-left image of [C] only), and (F) tight slit pore density, reflecting foot process effacement. (G) Representative immunoblots (left) of RhoA-GTP (21 kDa), total RhoA (21 kDa), and β-actin (42 kDa) from renal tissue lysates from experimental mice and dot plots summarizing the data from the experimental groups (right). (H) Schematic representation of the working model: aPC cannot interact with integrin-αvβ3 in β3ΔPod mice, resulting in unopposed PAR1-RhoA signaling, aggravating podocyte dysfunction and hence promoting dNP in mice with increased aPC levels. The data shown in dot plots represent the mean±SEM of at least ten mice (A), five mice (B and D–F), or four mice (G) per group. *P<0.05, **P<0.01, ***P<0.005. (A and C–E) ANOVA with Tukey-adjusted post hoc comparison; for each genotype diabetic mice were compared do nondiabetic mice, and diabetic mutant mice were compared with diabetic wild-type mice. C, nondiabetic control mice; DM, mice with persistent hyperglycemia after STZ injection; MFI, mean fluorescent intensity.
