
FIGURE 2.
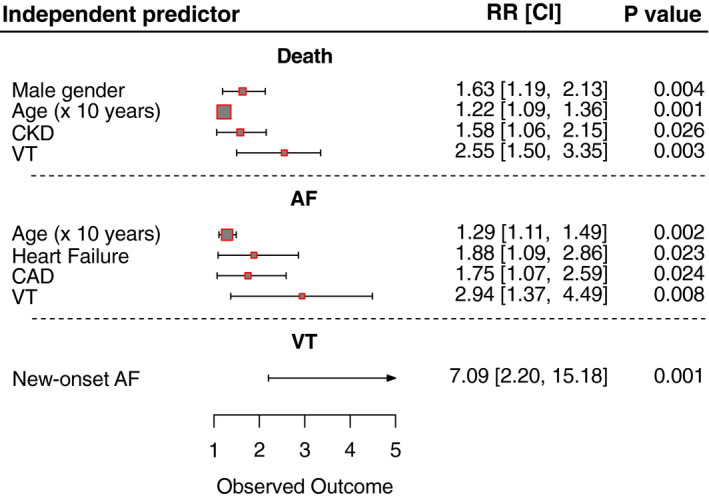
Forest plot visual summary of the results of logistic regression models. AF, atrial fibrillation; CAD, coronary artery disease; CKD, chronic kidney disease; VT, ventricular tachycardia
Official websites use .gov
A
.gov website belongs to an official
government organization in the United States.
Secure .gov websites use HTTPS
A lock (
) or https:// means you've safely
connected to the .gov website. Share sensitive
information only on official, secure websites.
Forest plot visual summary of the results of logistic regression models. AF, atrial fibrillation; CAD, coronary artery disease; CKD, chronic kidney disease; VT, ventricular tachycardia