
Fig. 2.
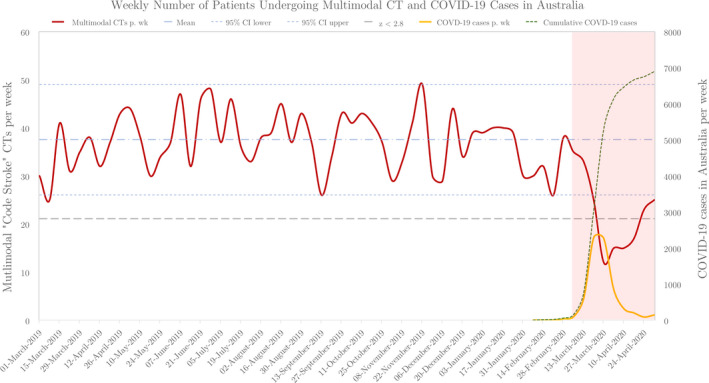
Number of patients who underwent multimodal ‘code stroke’ CT each week (03/01/2019–05/10/2020) for suspected acute ischaemic stroke (solid red line). Mean (dot‐dash blue line) and 95% confidence intervals (dashed blue lines) of weekly patient numbers for the pre‐pandemic period. Datapoints below the dashed grey line ( z = 2.8) line are significantly lower than the mean weekly case number (p < 0.0025). The pandemic period is highlighted by the red overlay box. Number of weekly new COVID‐19 cases in Australia (dashed orange) and corresponding cumulative numbers (dashed green) are shown. Starting with the beginning of the pandemic period, a clear decline in the weekly number of scans can be seen that corresponds well with the onset and duration of the peak of the COVID‐19 pandemic.