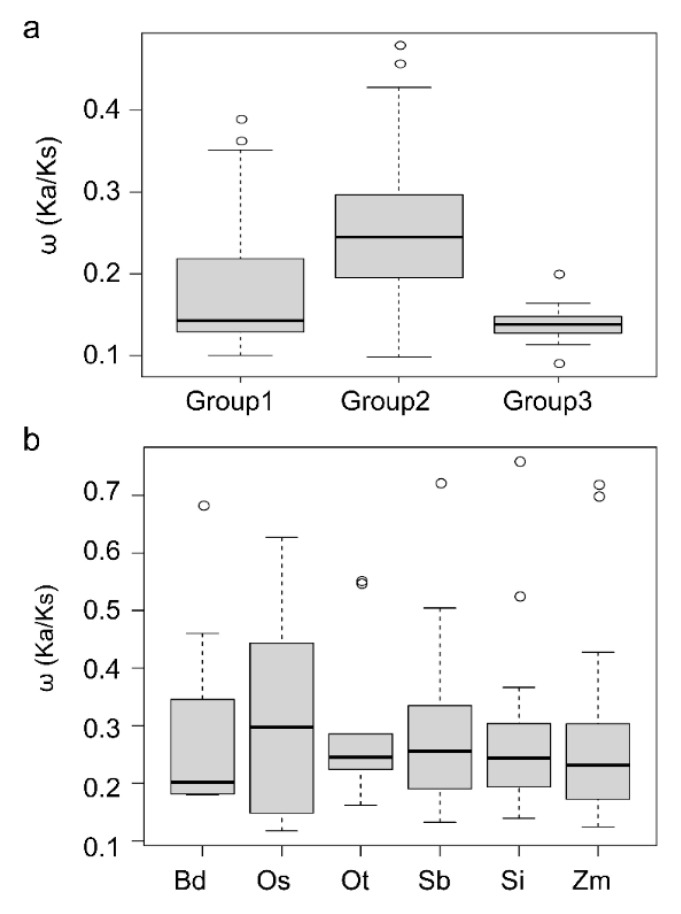
Figure 3.
The ω (Ka/Ks ratio) value of MACPF genes in Poaceae genomes. Distribution of Ka/Ks values were obtained from pairwise comparisons within Groups I, II and III (a), and within each Poaceae genome (b). The Y-axis denotes Ka/Ks ratios of MACPF genes for each pair. Boxplots were generated in R.

