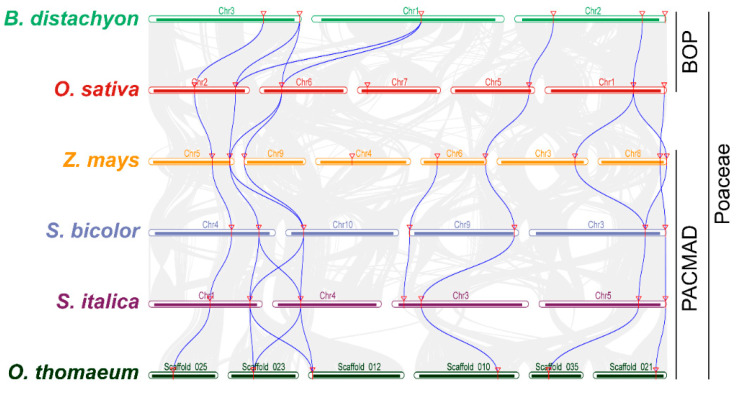
Figure 4.
Chromosomal synteny and collinearity analysis of MACPF genes across the Poaceae. Putative orthologous genes among Poaceae genomes are connected by lines using the MCScanX software. Red triangles represent MACPF genes in Brachypodium distachyon, Oryza sativa, Zea mays, Sorghum bicolor, Setaria italica, and Oropetium thomaeum. Blue solid lines represent collinearity relationships of orthologous MACPF gene pairs.

