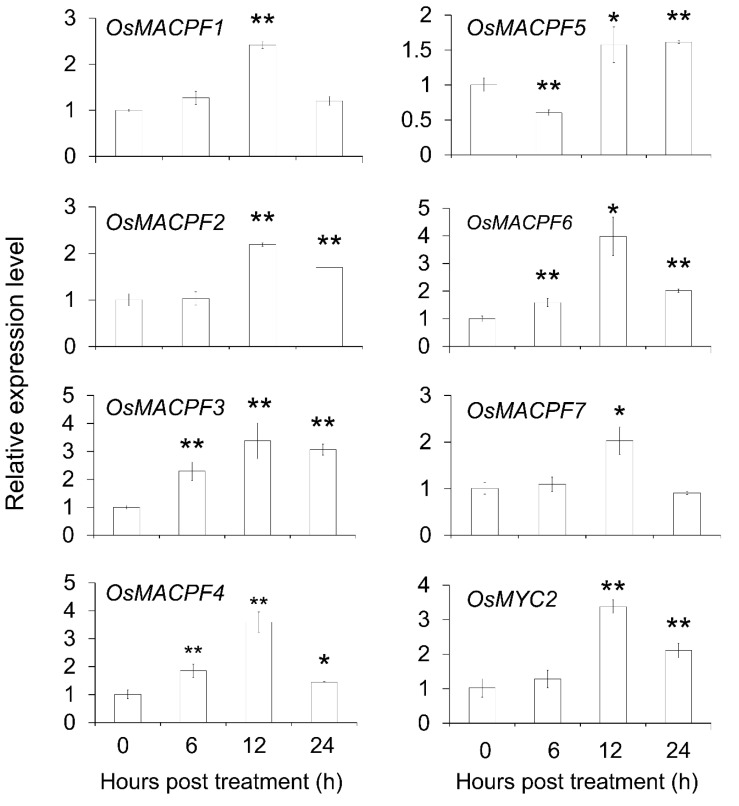
Figure 7.
Expression profile of OsMACPF genes upon MeJA treatment. Quantitative reverse transcription PCR (qRT-PCR) analysis of OsMACPF1-7 genes after JA treatment for 6, 12, and 24 h. Rice plants at the four-leaf stage were sprayed with 100 μM MeJA. They were placed in a greenhouse 28/23 °C (light/dark), light period 10 h light/14 h darkness. OsMYC2 was the positive control for MeJA treatment. Transcript levels were normalized using OsACTIN as the internal reference. Each data point represents the average of three biological repeats. * p < 0.05; ** p < 0.01 by Student’s t-test.

