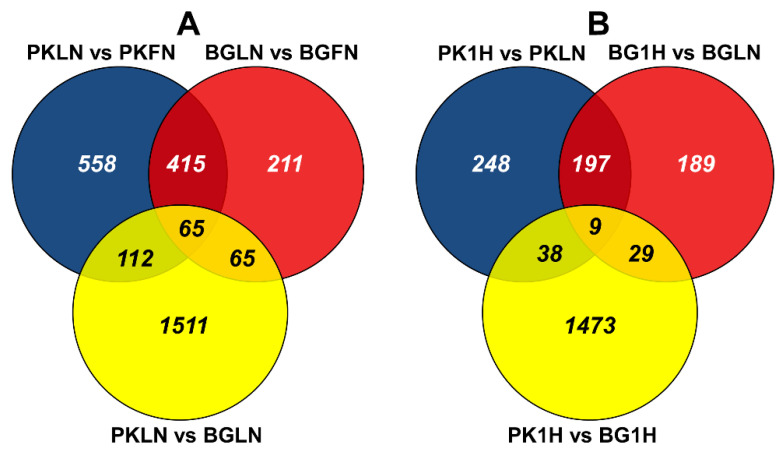
Figure 4.
Venn diagrams showing differentially expressed genes (DEGs) in Pokkali and Beng al under low N stress and 1-h recovery; |log2 fold change| ≥ 2 and padj < 0.01). (A) Comparison of low N vs. full N, and (B) comparison of low N vs. 1 h after transfer to full N. Treatment groups are PKFN (Pokkali-full nitrogen), PKLN (Pokkali-low nitrogen), PK1H (Pokkali 1 h after transfer from low N to full N), BGFN (Bengal-full nitrogen), BGLN (Bengal-low nitrogen), and BG1H (Bengal 1 h after transfer from low N to full N).

