-
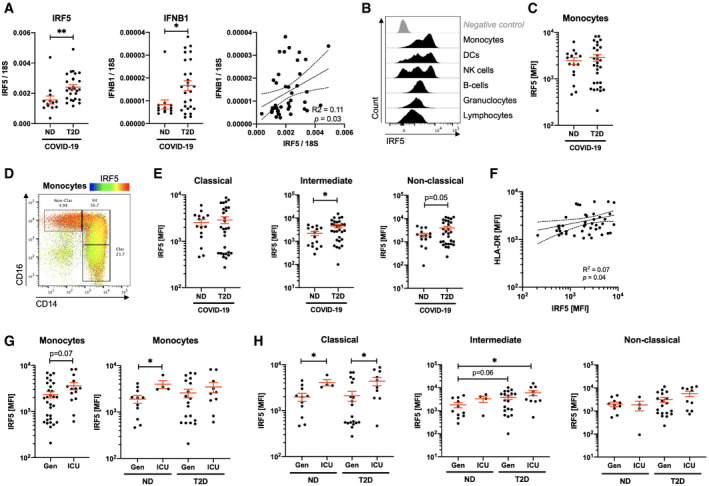
A
Quantification of IRF5 and IFNB1 mRNA expression in peripheral blood mononuclear cells of non‐diabetic (ND) and type 2 diabetic (T2D) COVID‐19 patients.
-
B
Histograms of IRF5 expression on different populations analysed by flow cytometry on venous blood samples.
-
C
IRF5 median fluorescence intensity (MFI) in monocytes of ND and T2D patients with COVID‐19.
-
D
IRF5 expression overlaid onto monocyte phenotypic gating.
-
E
IRF5 expression (MFI) in monocyte subtypes from ND and T2D COVID‐19 patients.
-
F
HLA‐DR and IRF5 expression in monocytes from COVID‐19 patients.
-
G
IRF5 expression in monocytes of ND or T2D COVID‐19 patients admitted to the intensive care unit (ICU) or treated exclusively in general wards (Gen).
-
H
IRF5 expression in monocytes of ND or T2D COVID‐19 patients admitted to the ICU or treated exclusively in Gen.
Data information: Data are presented as mean ± SEM. Differences between groups were evaluated with unpaired
t‐test. Analysis of variance (ANOVA) was used for multiple group comparisons. *
p < 0.05 and **
p < 0.01. For correlative analysis, Spearman's test was carried out calculating a 2‐tailed
P‐value. See also
Appendix Fig S3. Sample size and exact
P‐value in
Appendix Table S5.
Source data are available online for this figure.