
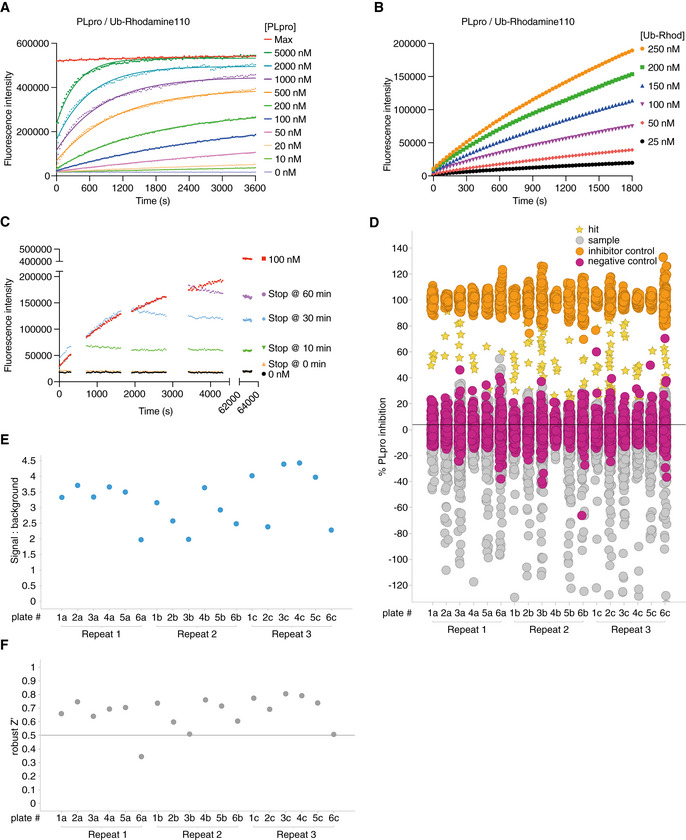
Figure EV4. Developing a high‐throughput screen to identify SARS2 PLpro inhibitors.
-
ASuitable SARS2 PLpro concentrations were determined by kinetic analysis of increasing Ub‐Rhodamine fluorescence over 1 h (3,600 s). Concentrations ranged from 10 to 5,000 nM with sufficient signal obtained with 50 nM SARS2 PLpro at a constant concentration of 100 nM Ub‐Rhodamine. Maximal signal (Max) indicates pre‐incubated Ub‐Rhodamine with 25 nM PLpro for 1 h, to achieve complete cleavage of Ub‐Rhodamine, before measurement.
-
BTo determine the optimal substrate concentration, 50 nM SARS2 PLpro was incubated with 25–250 nM Ub‐Rhodamine for 30 min (1,800 s). A final concentration of 100 nM Ub‐Rhodamine was selected, which was well below K M for SARS2 PLpro, in the linear range of the reaction, with a signal to background (S:B) above 3 at 12 min (720 s). 12 min was the timepoint selected for end‐point assays.
-
CEnzymatic reactions were stopped with addition of citric acid at a final concentration of 10 mM at indicated timepoints. The assay was benchmarked against compound rac5c (see below, Figs 5 and EV5). Rac5c inhibited SARS2 PLpro activity with an IC50 of 0.81 μM (Fig 5C, see Materials and Methods, Appendix Table S1).
-
DResults from the complete screen, by plate number (also see Dataset EV1).
-
ESignal:background analysis from the whole screen by plate number. 17 out of 18 plates met the quality control criteria (S:B > 2).
-
FRobust Z′ analysis of the whole screen by plate number. Plate 6a, which did not meet quality criteria in S:B and robust Z′ analysis, was excluded from analysis.