
Figure 1.
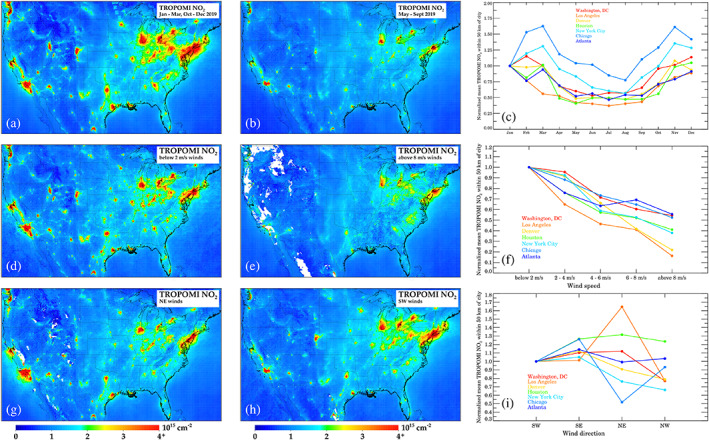
Effects of meteorology and solar zenith angle on column NO2. Top panels show (a) TROPOMI NO2 during the warm season (May–Sept 2019), (b) during the cold season (January–March and October–December 2019), and (c) the monthly variation in seven U.S. cities normalized to January 2019. Middle panels show (d) TROPOMI NO2 when winds are <2 m/s, (e) when winds are >8 m/s, and (f) variations in NO2 as a function of wind speed for seven cities normalized to stagnant conditions. Bottom panels show (g) TROPOMI NO2 when winds are northeasterly, (h) when winds are southwesterly, and (i) variations as a function of wind direction for seven cities normalized to southwesterly winds. Wind variations are using the complete TROPOMI record preceding 1 January 2020 (1 May 2018 to 31 December 2019).