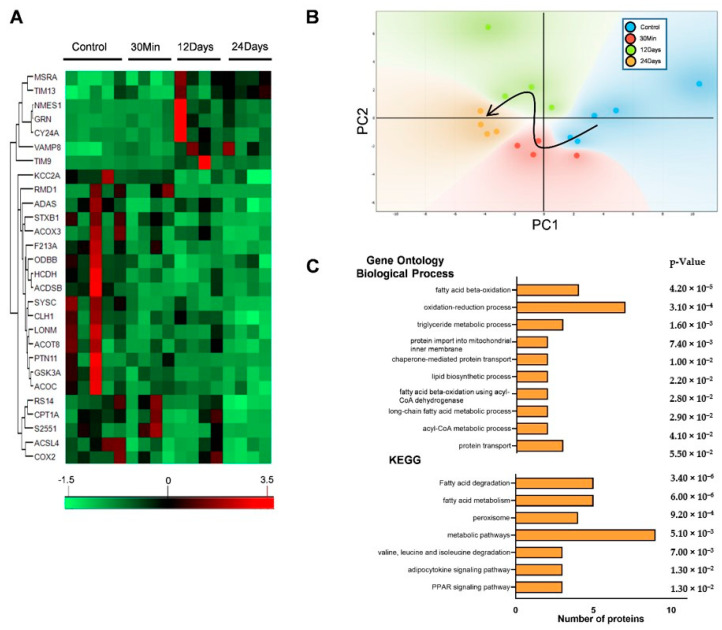
Figure 1.
Mitochondrial proteome was significantly altered with complex III inhibition. The quantitative proteomics data were processed using the Perseus software package. (A) Unbiased hierarchical clustering of the 28 significantly affected mitochondrial proteins with complex III inhibition. (B) Unbiased principal component analysis (PCA) of the 28 significantly affected proteins revealed that the protein expression differences of the individual biological samples within each group were consistent, and no outliers were detected. The black arrow in the PCA plot represents the trajectory of changes by the treatment time (n = 4–5). Functional annotation using Database for Annotation, Visualization, and Integrated Discovery (DAVID) with significant pathways arranged according to the p-value. (C) Representation of significantly enriched processes in the GO-BP (Gene Ontology biological process) and pathways in Kyoto Encyclopedia of Genes and Genomes (KEGG).

