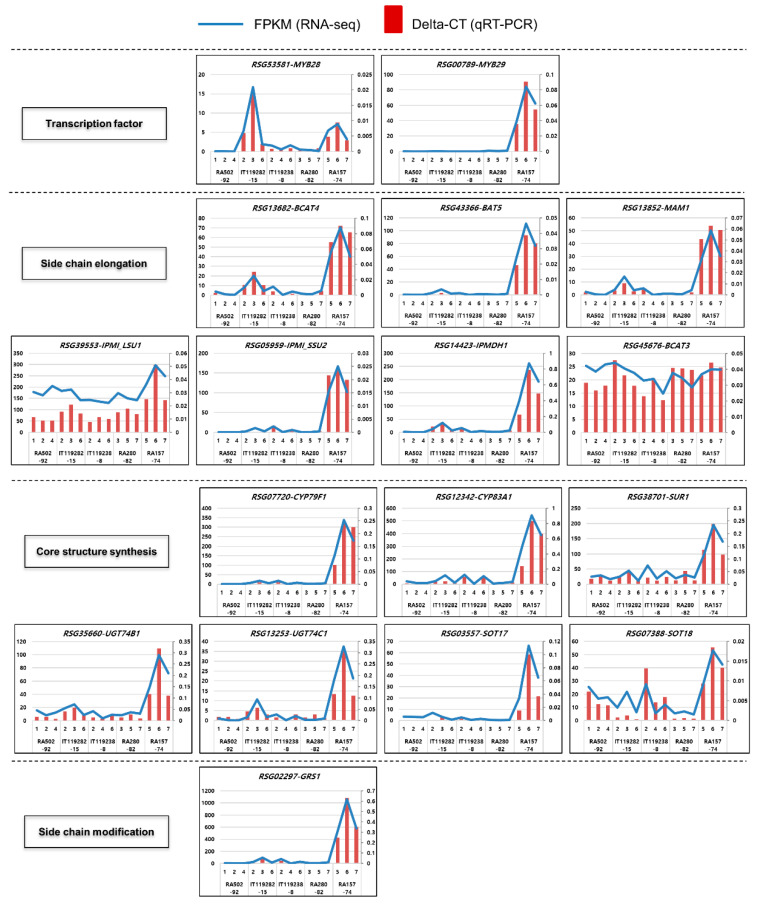
Figure 6.
qRT-PCR examination of aliphatic GSL biosynthesis genes in radish roots. The GSL biosynthesis genes were analyzed by qRT-PCR, and the value was compared with the FPKM value. The blue lines represent the FPKM (left y-axis) data, and the red bars indicate the qRT-PCR data (right y-axis). The expression level of qRT-PCR was measured by the delta CT method.

