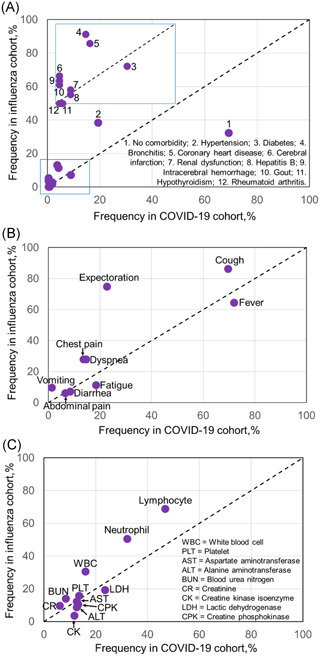
Figure 1.

Frequency of each (A) comorbidity, (B) symptom, or (C) blood parameter in COVID‐19 cohort was plotted versus that in influenza cohort. Diagonal line (dotted) indicated a hypothetically equal frequency between the two cohorts. Arrows pointed to those that were partially overlapped or specifically indicated. COVID‐19, coronavirus disease 2019
