
FIGURE 2.
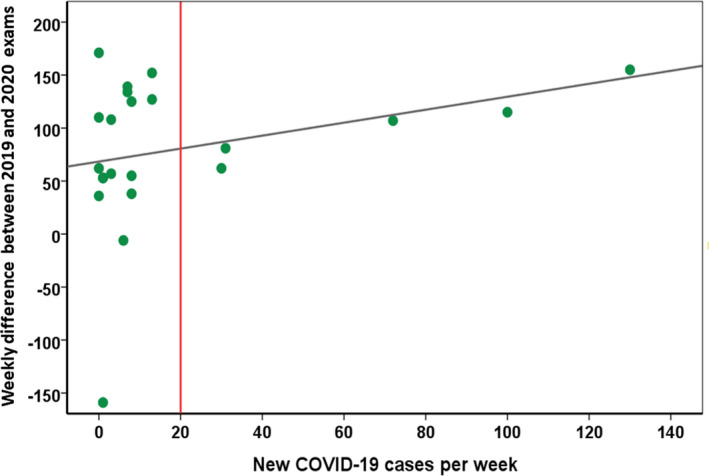
Correlation of new weekly COVID‐19 cases and weekly difference of total mammography examinations. The difference of weekly mammography examinations (2019 minus 2020) shows a low positive correlation with new weekly COVID‐19 cases (r = .30, P = .17). Above a selected threshold (>20 new COVID‐19 per week), the difference of weekly mammography shows a high positive correlation with weekly new COVID‐19 cases