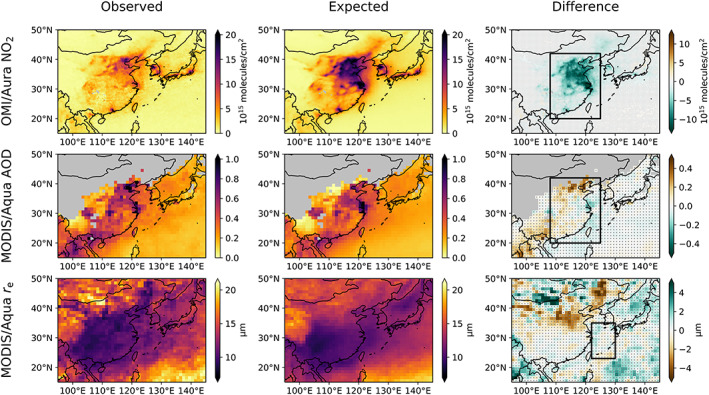
Figure 2.

Change in pollution over China for February 2020. (left column) Observed values, (middle column) estimated values, and (right column) their difference are shown for (top row) NO2, (middle row) AOD, and (bottom row) r e. Shading is such that lighter (left and middle columns) and greener (right column) colors align with what would be expected for less pollution. Areas without valid data are shaded in gray. Gray stippling indicates absolute differences below 2ε RMS. Black boxes in the right column indicate areas used for the regional averages.
