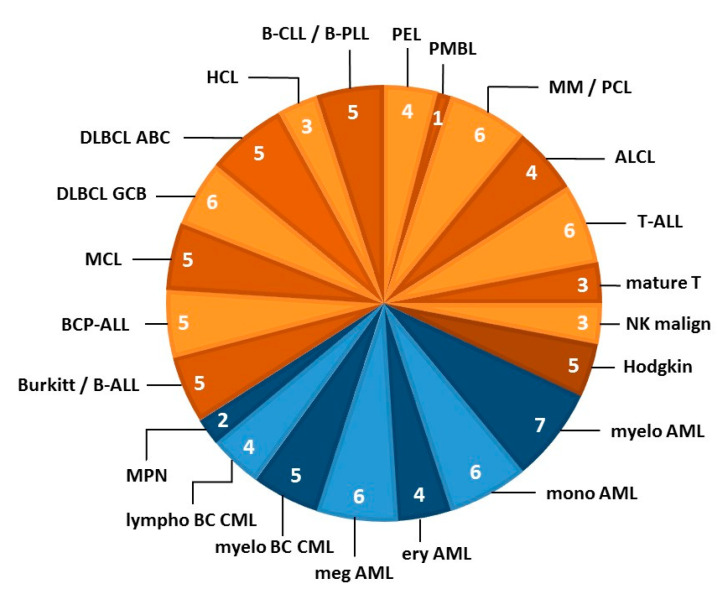
Figure 2.
LL cell line stratification by disease category. The pie chart shows the 22 entities from which LL cell lines were derived that contributed to the LL-100 panel. Blue segments organized by entity represent myeloid malignancies and orange segments indicate lymphoid neoplasms (based on the revised WHO classifications of myeloid and lymphoid neoplasms; references [31,32]). The number of cell lines per entity is indicated in each segment. Each subset of LL cell lines was specifically tailored to represent this entity. The figure concept was further developed from Drexler et al. [33]. Abbreviations of disease entities: ABC, activated B-cell; ALCL, anaplastic large cell lymphoma; ALL, acute lymphoblastic leukemia; AML, acute myeloid leukemia; BC, blast crisis; BCP, B-cell precursor; CLL, chronic lymphocytic leukemia; CML, chronic myeloid leukemia; DLBCL, diffuse large B-cell lymphoma; ery, erythoid; GCB, germinal center B-cell; HCL, hairy cell leukemia; LL, lympbolastic lymphoma; lympho, lymphoid; malign, malignancy; MCL, mantle cell lymphoma; meg, megakaryocytic; myelo, myelocytic/myeloid; MM, multiple myeloma; mono, monocytic; MPN, myeloproliferative neoplasm; NK, natural killer; PCL, plasma cell leukemia; PEL, primary effusion lymphoma; PLL, prolymphocytic leukemia; PMBL, primary mediastinal B-cell lymphoma.

