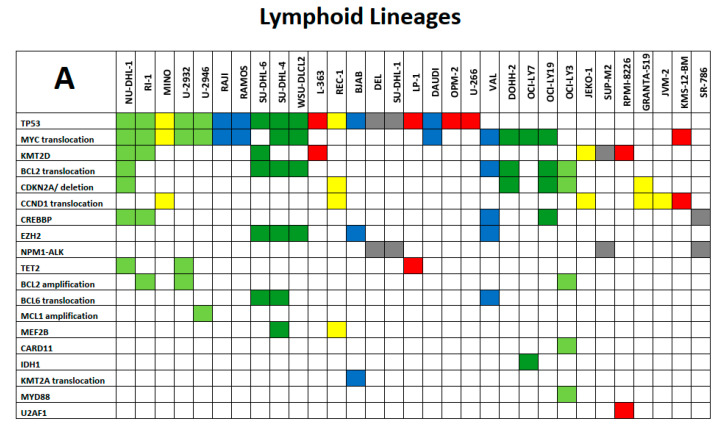
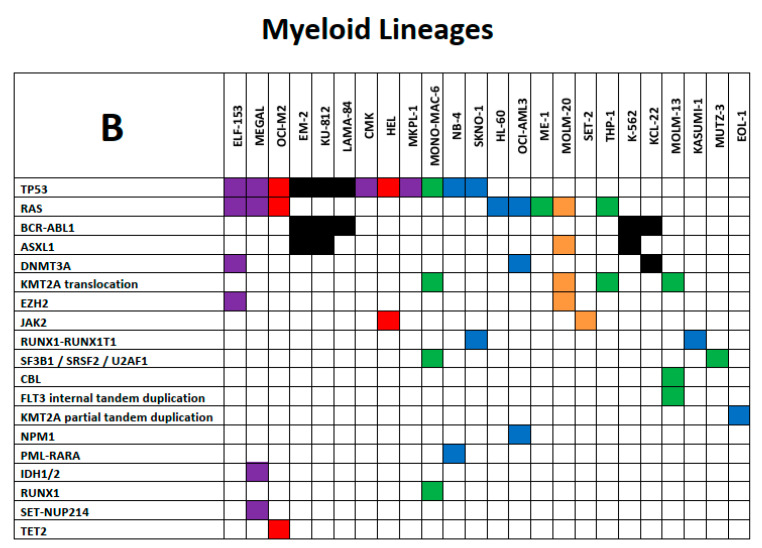
Figure 3.
(A) and (B): Exemplary spectrum of selected mutational signatures in lymphoid and myeloid LL cell lines. Mosaic plot of mutant genes and chromosomal aberrations that are displayed in rows ordered by recurrence (top to bottom); cell lines are listed in columns. All mutations are annotated in the COSMIC database (hence carrying specific COSM numbers) and minimal allele frequency for mutation calling was set at < 0.01. (A) Color code of lymphoid LL cell lines: grey, ALCL; blue, Burkitt/B-ALL; light green, DLBCL ABC; dark green, DLBCL GCB; yellow, MCL; red, MM/PCL. (B) Color code of myeloid LL cell lines: blue, AML myelocytic; green, AML monocytic; red, AML erythroid; purple, AML megakaryocytic; black, CML myeloid blast crisis; orange, myeloproliferative neoplasms. The tables are not intended to be comprehensive across all aspects of leukemia–lymphoma-related alterations but instead to serve as focused high-priority areas.


