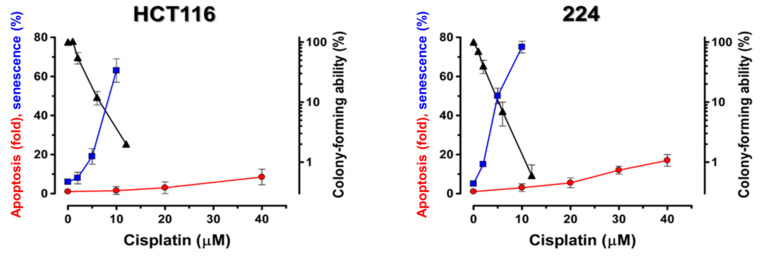
Figure 3.
Dose-response curves for loss of colony-forming ability and for the induction of apoptosis and therapy-induced cell senescence (TCS) in HCT116 (colon carcinoma) and 224 (melanoma) p53-WT human tumour cells treated with increasing concentrations of cisplatin for 6 h. (▲) colony-forming ability assayed at 10 days posttreatment, (●) apoptosis based on caspase-3 activation assayed at 14 h posttreatment, and (■) TCS based on a combination of senescence-associated β-galactosidase activity and PKH2 staining assayed at 6 days posttreatment. Data from Berndtsson et al. [69].

