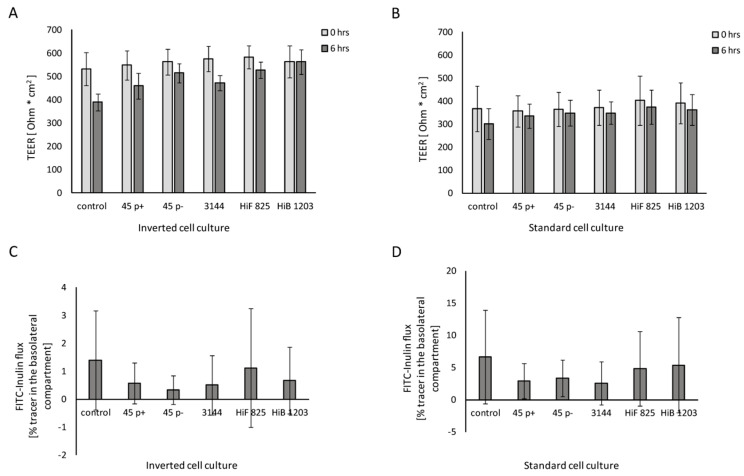
Figure 2.
Barrier integrity of HIBCPP cells infected with the indicated NTHI, HiF and HiB isolates Figure 0 h, black bars). TEER values of cells cultured in: (A) the inverted cell culture system; and (B) the standard cell culture system at the time of infection (time point 0 h, grey bars) and at the end of infection (time point 6 h, black bars). Percentage of FITC-labeled inulin flux of HIBCPP cells grown in: (C) the inverted cell culture system; and (D) the standard culture system. Infection was carried out for 6 h, and uninfected control cells were analyzed in parallel. The FITC-inulin flux was measured in apical-to-basolateral direction and is expressed as percentage of tracer in the basolateral compartment. Each experiment was repeated at least three times with at least three replicates. All data are shown as mean and error bars depict standard deviation.

