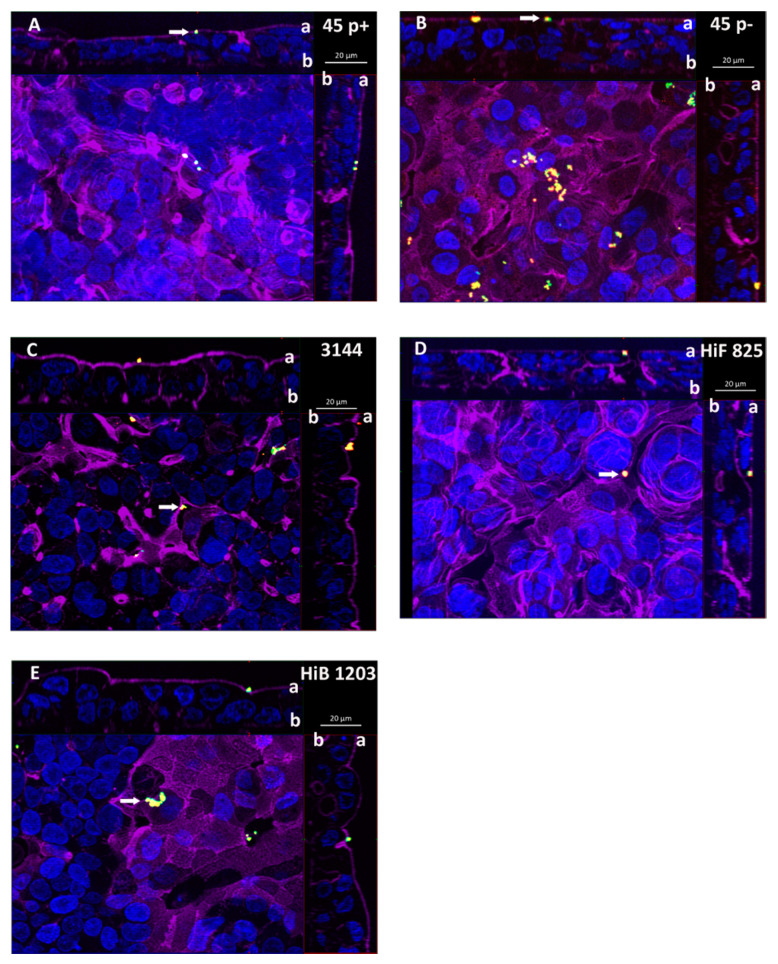
Figure 5.
DIF sections of HIBCPP cells apically infected with the indicated Haemophilus strains. Cells were grown in the standard cell culture system and challenged with a MOI of 20 of: (A) the nasopharyngeal NTHI isolate 45 p+ (fimbriated variant); (B) the nasopharyngeal NTHI isolate 45 p− (non-fimbriated variant); (C) the NTHI CSF isolate 3144; and with the encapsulated H. influenzae CSF isolates (D) HiF 825 and (E) HiB 1203. After 6 h of infection cells were subjected to DIF staining to analyze invasion. Intracellular bacteria are visualized in green and extracellular bacteria in yellow. DAPI (blue) and phalloidin (purple) were used to stain the cell nuclei and the actin cytoskeleton, respectively. (A–E) Apotome images of apically infected HIBCPP cells. The center part of each panel represents the xy en face view. An overlay of selected slices through the z-axis intensifies images for presentation. The top and side part of each panel represent the cross-sections through the z-plane of slices in the overlay. In the cross sections the apical cell side facing the top and the right side, respectively, is labeled with ”a” and the basolateral cell side facing the center part is labeled with “b”. A characteristic distribution for the individual strains is represented. Almost no invaded bacteria (green) could be detected in the standard cell culture infected cells. Extracellular bacteria (yellow) adhering to the apical cell side (CSF facing side) are marked with a white arrow.

