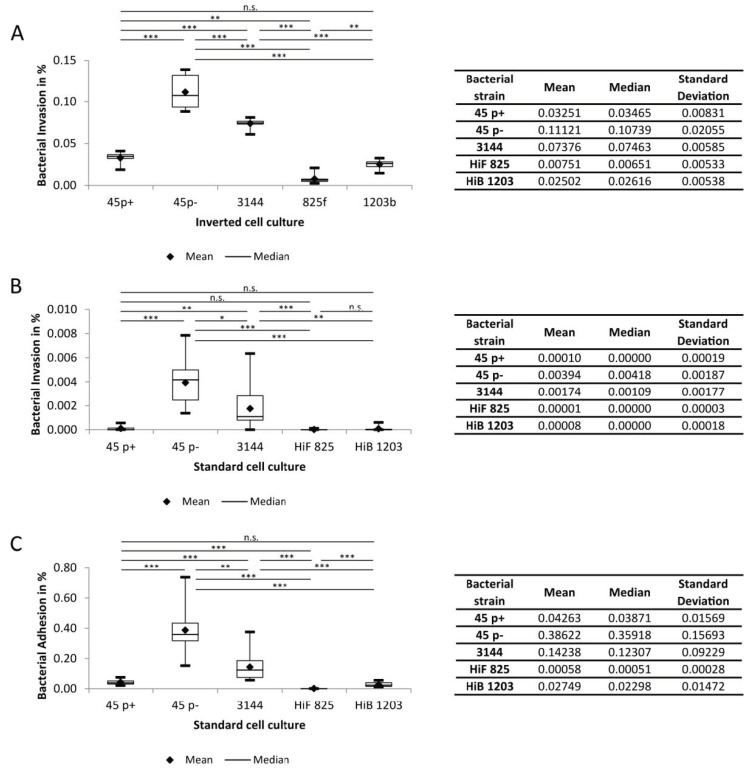
Figure 7.
Invasion and Adhesion rates of indicated H. influenzae strains. Invasion upon infection with a MOI of 20 was counted after 6 h of infection: (A) invasion rates in the inverted cell culture (n = 9); (B) invasion rates in the standard cell culture ((n = 12, n = 13 for HiF 825); and (C) adhesion rates in the standard cell culture. Each experiment was repeated at least three times with at least three replicates. All data are shown as mean and median together with quartiles, minimum and maximum. The box depicts the interquartile range (25% and 75%). * p < 0.05; ** p < 0.01; *** p < 0.001; n.s., not significant.

