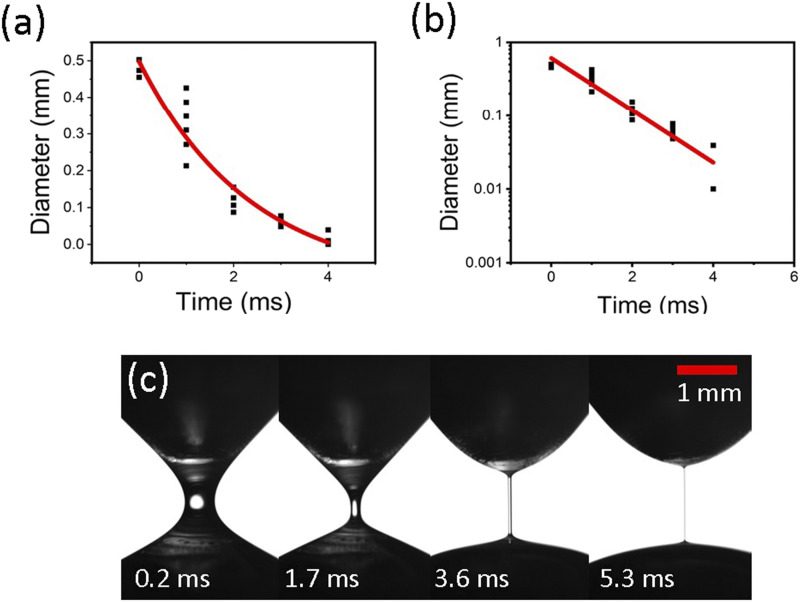
FIG. 6.
Self-thinning thread of 2 wt. % PAA solution. (a) Thread cross-sectional diameter D vs time and (b) the corresponding semi-logarithmic plot. The experimental data are shown by symbols, while the theoretical result is shown by the red curve D = D0 exp(−t/3θ), where t is time and D0 is the diameter value at t = 0. (c) Several snapshots of the self-thinning process.

