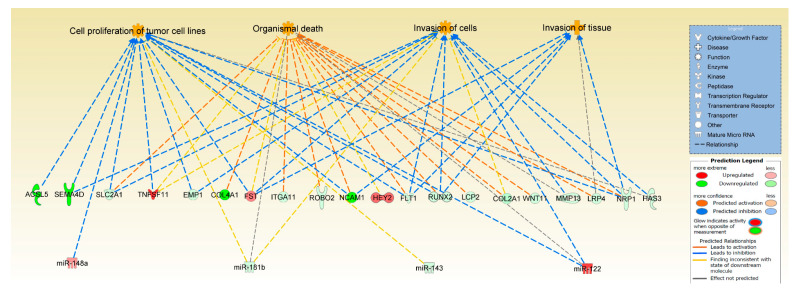
Figure 3.
Significant pathways and networks affected in cartilage ageing. IPA was used to pair differentially expressed mRNA and miRNA data from ageing equine cartilage and chondrocytes. Figure is a graphical representation between molecules identified in our data in their respective networks. Red nodes; upregulated gene expression in old group; green nodes; downregulated gene expression in old group. Intensity of colour is related to higher fold-change. The key to the main features in the networks is shown.

