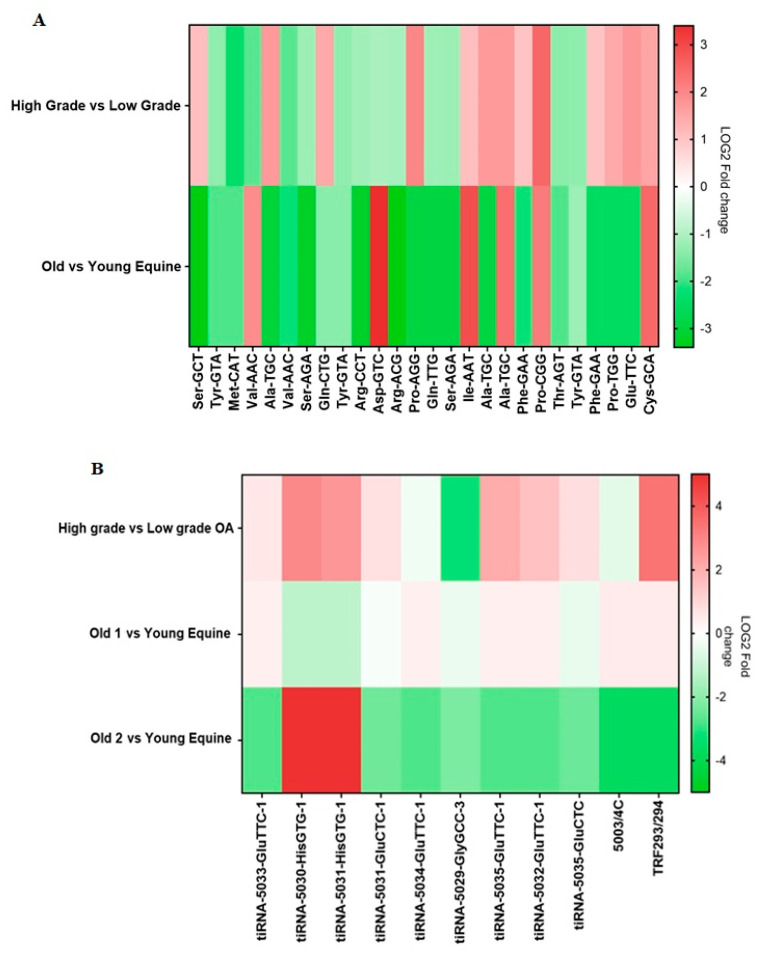
Figure 6.
tRNA analysis of human osteoarthritic cartilage. (A) High grade versus low grade OA human cartilage and old versus young equine chondrocyte tRNA profiles. Heatmap of Log2 fold change expression of 26 tRNAs detected in both human and equine samples. Human cartilage tRNAs detected using a Human tRNA PCR Array. Red highlights induced tRNA expression in high grade OA human cartilage compared to low grade and in old equine chondrocytes compared to young. Green highlights reduced tRNA expression in high grade OA human cartilage compared to low grade and in old equine chondrocytes compared to young. (B) High grade OA versus low grade OA human cartilage and equine tiRNA/tRF profiles. Heatmap of Log2 foldchange expression of 11 tRF/tiRNA fragments detected in both human and equine samples. Human cartilage tRF/tiRNA detected using a Human tRF&tiRNA PCR Array. Red highlights induced tRF/tiRNA expression in human high grade versus low grade OA samples and in old versus young equine samples. Green highlights reduced tRF/tiRNA expression in human high grade versus low grade OA samples and in old versus young equine samples.

