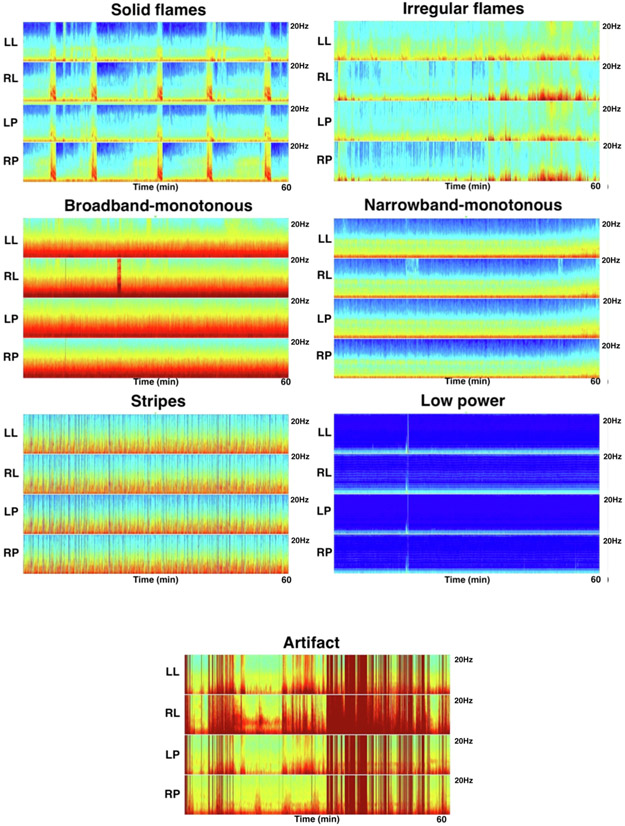
Fig. 1.
Quantitative EEG Spectrogram Nomenclature. Representative examples of the spectrogram nomenclature are shown. The scalp is divided into 4 different regions for spectrogram construction: Left lateral (Fp1, F7, T3, T5, O10; right lateral (Fp2, F8, T4, T6, O2); left parasagittal (Fp1, F3, C3, P3, O1); right parasagittal (Fp2, F4, C4, P4, O2). Each spectrogram image has four panels: left lateral (LL), right lateral (RL), left parasagittal (LP), right parasagittal (RP). Each spectrogram image shows one hour of recording. The vertical axis represents the spectrogram frequency from 0–20 Hz. “Solid flames” are characterized by an abrupt appearance of higher power and bandwidth, and have regular and have smooth edges. “Irregular flames” are characterized by choppiness and do not have smooth edges or a regular appearance. “Broadband-monotonous” is characterized by sustained higher power at low frequencies with minimal variation or very gradual waxing and waning of frequencies within the high-power band. “Narrowband-monotonous” is characterized by a sustained <5 Hz band of high power (yellow/red) with minimal variation within the high-power band. “Stripes” represent a burst suppressed background and characterized by rapid alternation between diffuse low power and high power and high frequencies. “Low power” spectrograms are characterized by diffuse low power, and appear monotonous. “Artifact” is characterized by irregular high-power signal saturating all frequencies. (For interpretation of the references to colour in this figure legend, the reader is referred to the web version of this article.)

