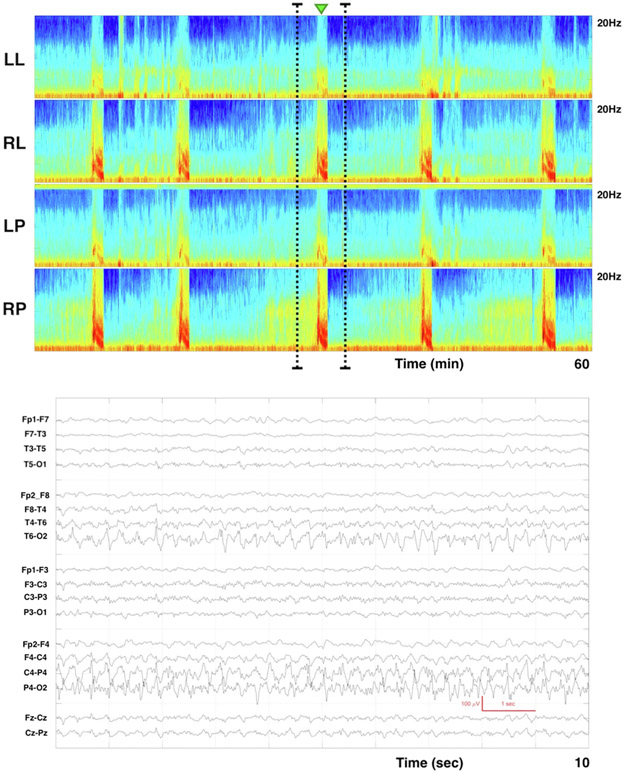
Fig. 2.
Example of spectrogram image and corresponding raw EEG clip. Each spectrogram image has four panels: Left lateral (LL), right lateral (RL), left parasagittal (LP), right parasagittal (RP). We divided the scalp into 4 different regions for spectrogram construction: Left lateral (Fp1, F7, T3, T5, O10; Right lateral (Fp2, F8, T4, T6, O2); Left Parasagittal (Fp1, F3, C3, P3, O1); Right Parasagittal (Fp2, F4, C4, P4, O2). Above each image is a small green arrow that represents the segment from which the corresponding raw EEG clip was obtained. Raters were asked to choose the spectrogram nomenclature that in their opinion was representative of the pattern immediately below the green arrow. The raw EEG image shows a 10 second clip of recording in a longitudinal bipolar montage. (For interpretation of the references to colour in this figure legend, the reader is referred to the web version of this article.)

