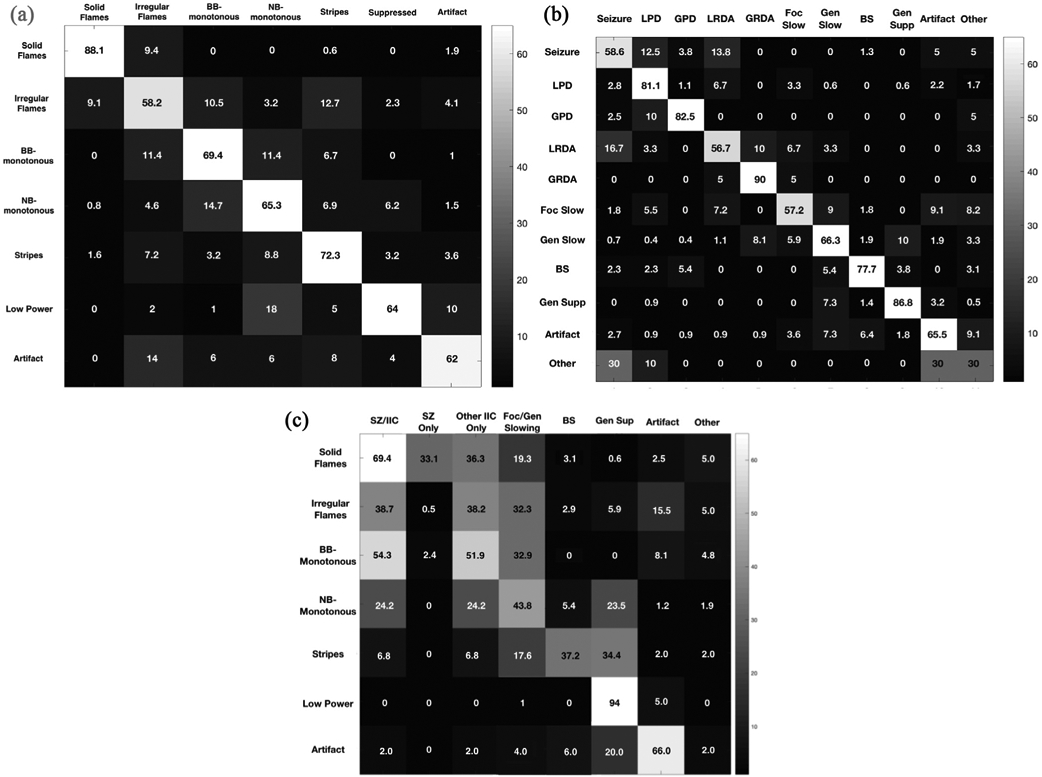
Fig. 4.

Agreement matrices. a. Agreement matrix showing sources of disagreement for spectrogram nomenclature is presented as a heat map. The spectrogram nomenclature categories are shown along the vertical and horizontal axes. Heat map intensities show the percentage of times each nomenclature option on the horizontal axis was chosen when the correct response (gold standard determined by majority consensus) was the one on the vertical axis. 100% agreement would produce a diagonal white line from upper left to lower right, with all the remaining squares not on that line being black. The figure demonstrates the majority had agreement in rating the spectrogram nomenclature. Any disagreement noted was primarily for patterns close or similar to each other. For example, when the gold standard response was solid flames, a small minority chose the incorrect response of irregular flames. Similarly when the correct answer was broadband-monotonous most incorrect responses were either irregular flames or narrowband-monotonous. BB-monotonous: Broadband-monotonous; NB-monotonous: Narrowband-monotonous. b. Agreement matrix showing sources of disagreement for raw EEG is presented as a heat map. The raw EEG categories are shown along the vertical and horizontal axes. Heat map intensities show the percentage of times each option on the horizontal axis was chosen when the correct response (gold standard determined by majority consensus) was the one on the vertical axis. 100% agreement would produce a diagonal white line from upper left to lower right, with all the remaining squares not on that line being black. The figure demonstrates the majority had agreement in rating the raw EEG. Similar to spectrogram nomenclature, any disagreement was noted primarily for patterns close to each other. For example when the correct or gold standard response was seizures, the small number of incorrect responses were periodic and rhythmic patterns. When the correct response was generalized slowing, incorrect responses were GRDA or suppression. BS: burst suppression; Foc slow: focal slowing; Gen slow: generalized slowing; Gen supp: generalized suppression; GPD: generalized periodic discharge; GRDA: generalized rhythmic delta activity; LPD: lateralized periodic discharges; LRDA: lateralized rhythmic delta activity. c. Agreement matrix showing relation of spectrogram nomenclature with raw EEG patterns is presented as a heat map. Heat map intensities show the frequency (in percent) each option on the horizontal axis was chosen when the correct spectrogram response (gold standard determined by majority consensus) was the one on the vertical axis. SZ/IIC: The frequency with which seizure or any other IIC pattern (i.e. LPDs/GPDs/LRDA/GRDA) were selected. SZ only: The frequency with which seizure was selected; Other IIC only: The frequency with which IIC patterns other than seizure (i.e. LPD/GPDs/LRDA/GRDA) were selected; Foc/Gen Slow: The frequency with which focal or generalized slowing were selected; BS: The frequency with which burst suppression was selected. BB: broadband; BS: burst suppression; Foc slow: focal slowing; Gen slow: generalized slowing; Gen supp: generalized suppression; GPD: generalized periodic discharge; GRDA: generalized rhythmic delta activity; IIC: Ictal-interictal; LPD: lateralized periodic discharges; LRDA: lateralized rhythmic delta activity; NB: narrowband; SZ: seizures.
