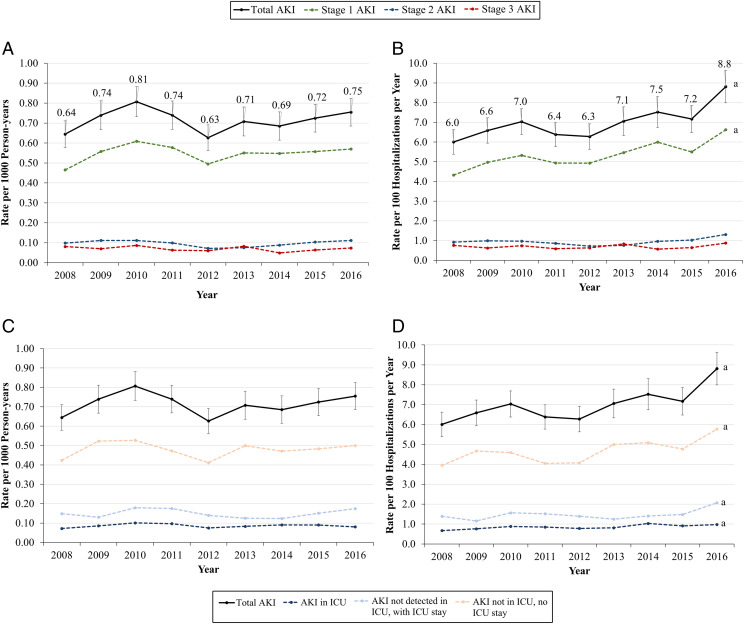
FIGURE 1.
Age- and sex-adjusted incidence of AKI, 2008–2016. A, Rate among all children, per 1000 person-years, by severity. B, Rate among hospitalized children, per 100 hospitalizations per year, by severity. C, Rate among all children, per 1000 person-years, by ICU status. D, Rate among hospitalized children, per hospitalizations per year, by ICU status. a Denotes trend P < .05.

