
Figure 10.
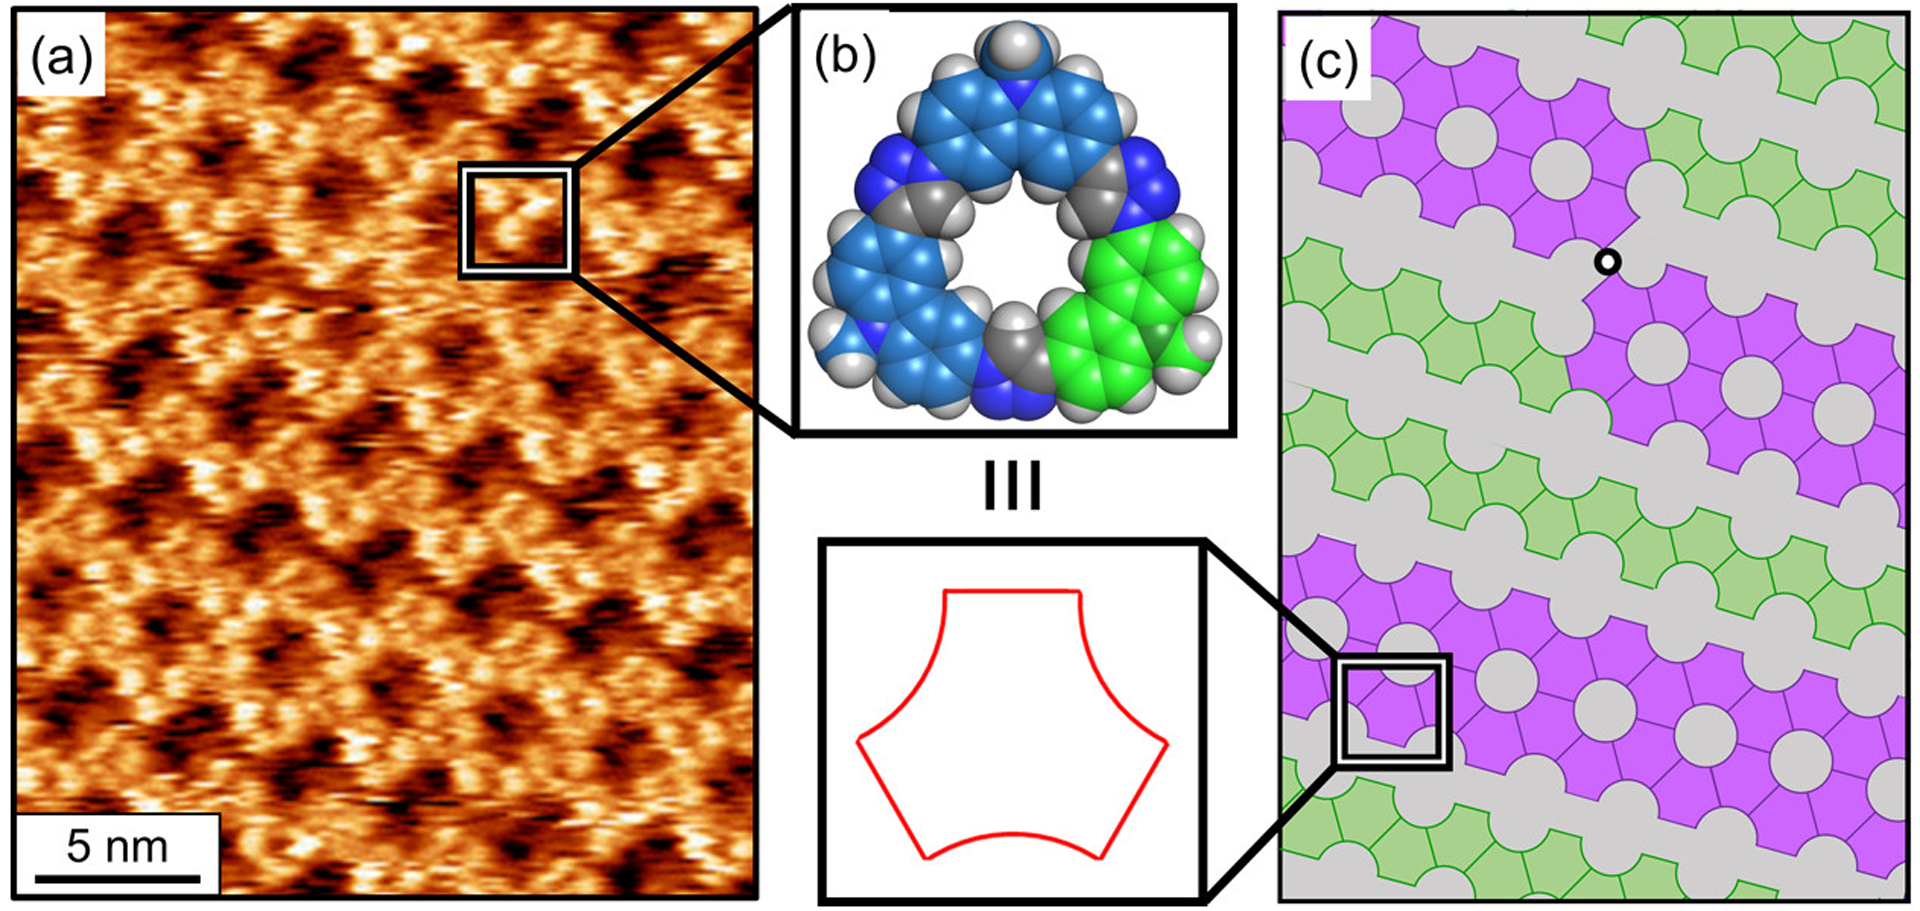
(a) High-resolution STM imaging of the gap phase formed by (b) TC-6618. (c) Model of the gap phase showing the zigzag (green), honeycomb (purple), and the line defect transition between the two structures (black dot).
Official websites use .gov
A
.gov website belongs to an official
government organization in the United States.
Secure .gov websites use HTTPS
A lock (
) or https:// means you've safely
connected to the .gov website. Share sensitive
information only on official, secure websites.
(a) High-resolution STM imaging of the gap phase formed by (b) TC-6618. (c) Model of the gap phase showing the zigzag (green), honeycomb (purple), and the line defect transition between the two structures (black dot).