
Figure 12.
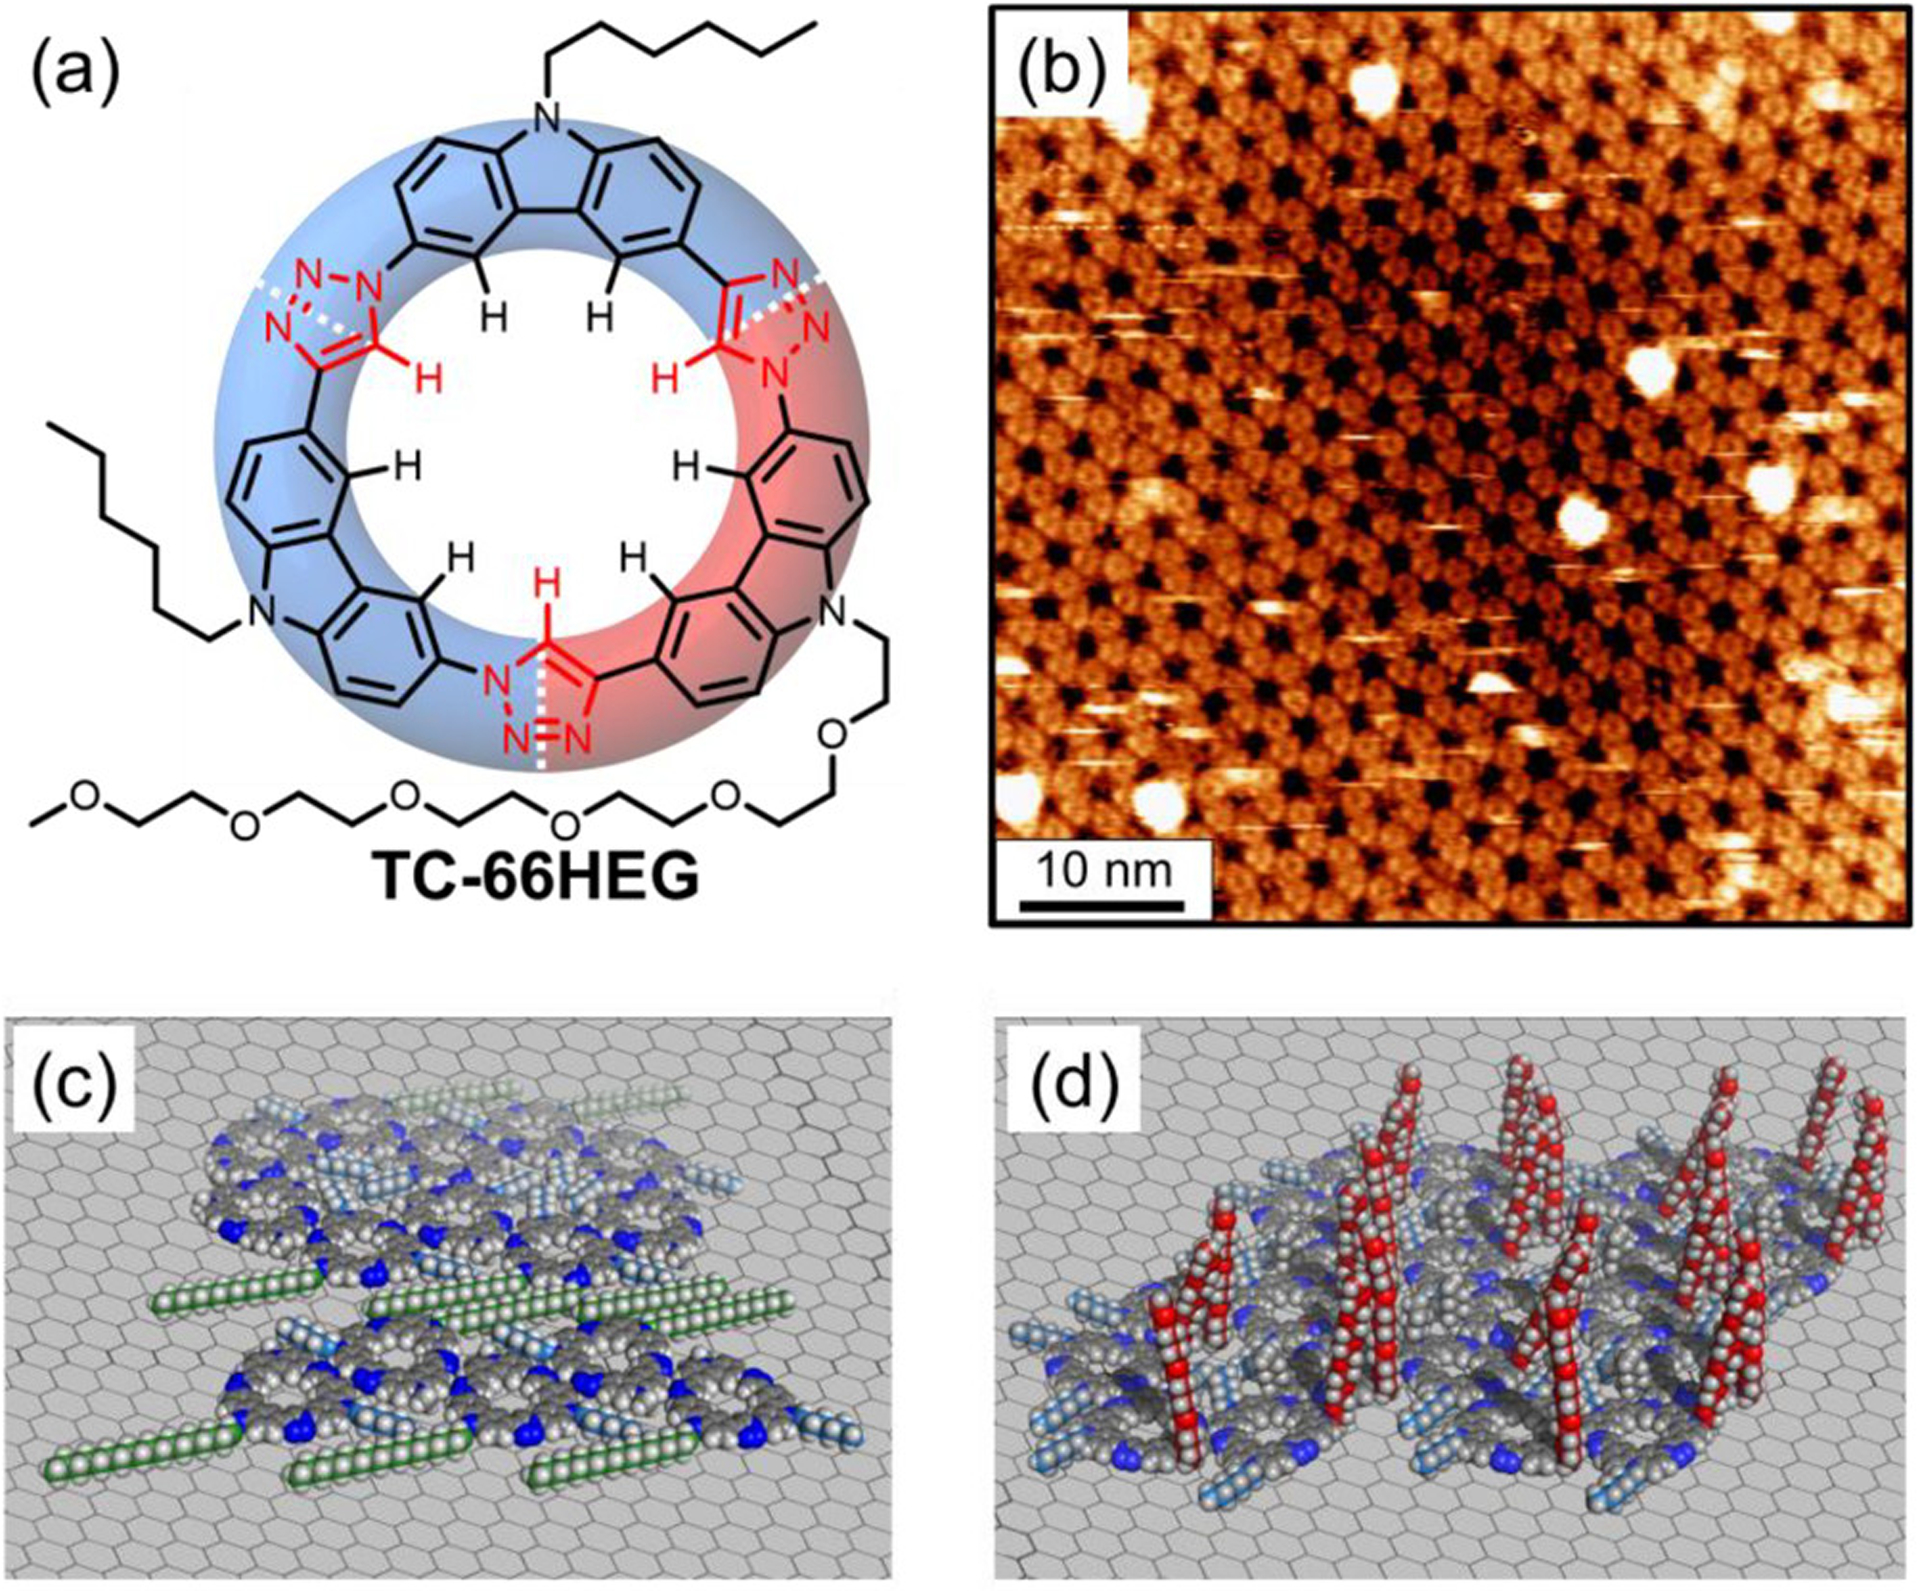
(a) Macrocycle TC-66HEG. (b) STM images of TC-66HEG at the TCB/graphite interface with honeycomb ordering (10 μM, It = 0.15 nA, Vsample = −0.7 V). (c) Models of the octadecyl chains (green) of TC-6618 surface adsorbed to form the gap and (d) HEG chains (red) of TC-66HEG directed away into solution leading to the formation of the honeycomb phase.